Layer Charts
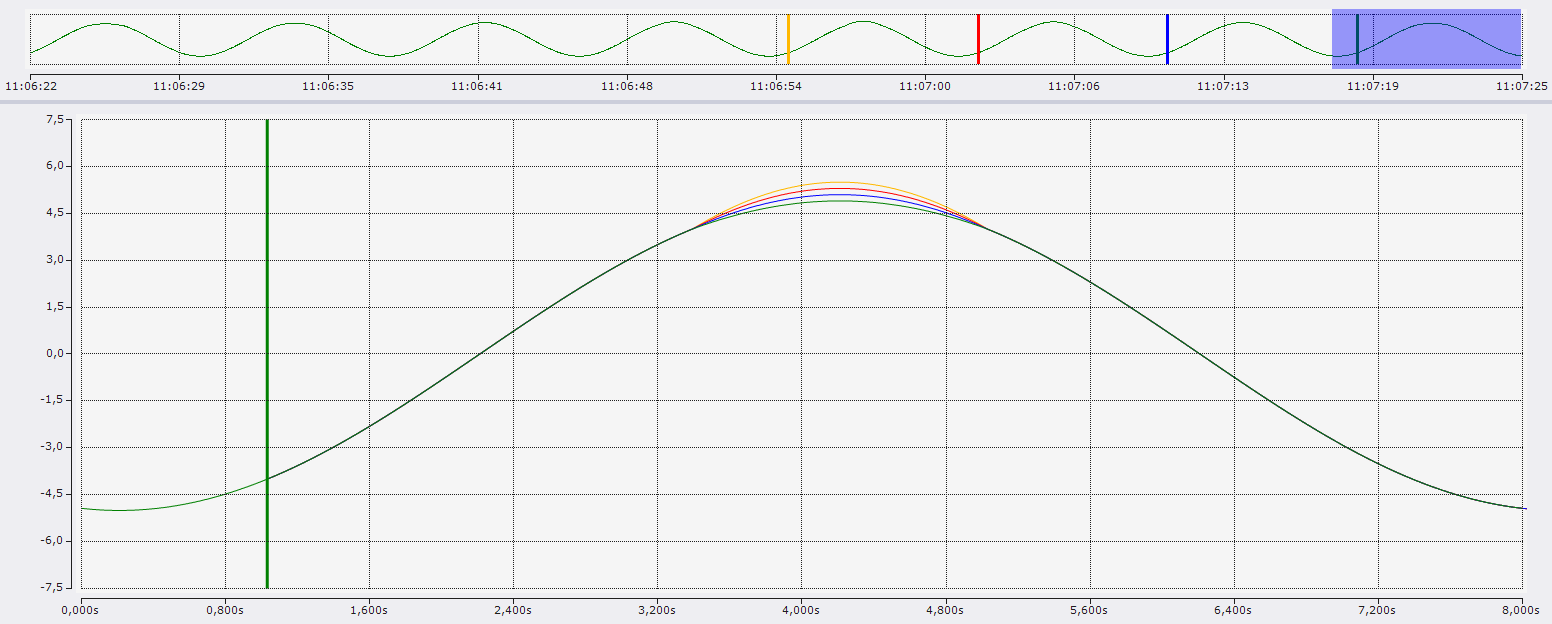
The layer function is used to compare signal curves with each other. Here it is possible to load reference curves so that they are visually displayed next to the data that is currently being recorded or was last recorded. In addition, data from the current recording at different times can also be compared.
Currently, these functions are implemented for YT and XY charts.