Basic functionality
To compare data with each other, various layers can be added under YT and XY charts. Here, a layer represents a collection of graphs that are displayed in the current chart. The data displayed in this layer are freely configurable.
The configurations for the Layer Chart are made exclusively in the Layer Editor.
Basic settings in the chart
First, a point in time (anchor point) must be selected in the chart. This anchor point serves as a starting point for all layers defined in this chart. For example, if reference curves are added, the anchor point is the point in the chart where the recording of the curve begins.
See the Layer Editor for more information on the various configuration options for this time point.
Basic settings in Ghosting mode
In Ghosting mode, data from different points in time can be superimposed from a current recording. In this mode, a point in time (data starting point) is first selected from the current recording. Now the graphs belonging to the layer show the data from the data starting point, only that the starting point in the display is no longer the recording time, but that of the anchor point of the chart.
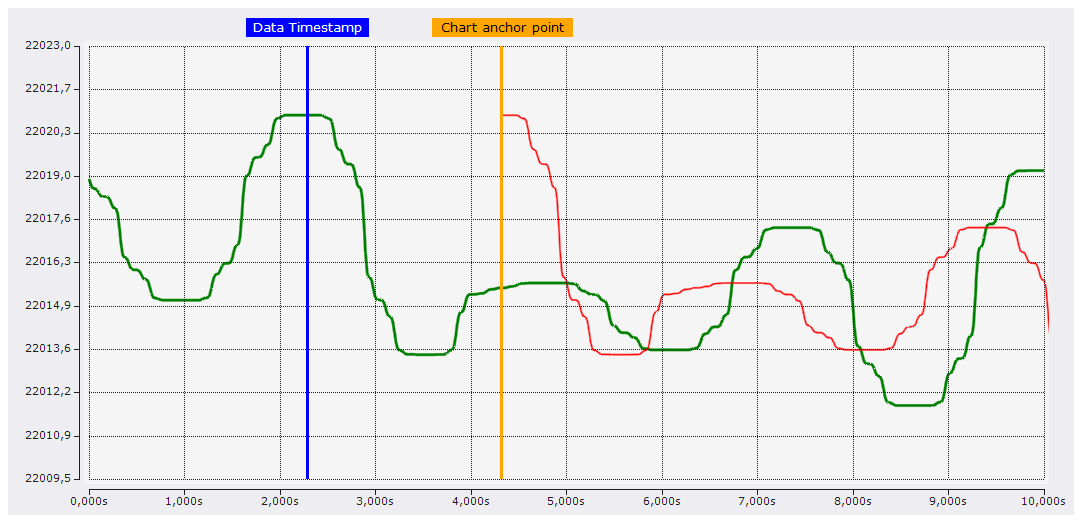
In the screenshot, the green graph shows the channel, which is known to be below the chart, and the red graph is the representation of a layer. The orange marker shows the anchor point of the chart and the blue marker shows the point in time, which is selected in the layer as the data starting point. Since the data in the layer is now drawn from the anchor point, the green graph is now slightly shifted in red.
Basic settings for reference curves
To compare the data of the current recording with reference curves, this reference data from the data pool must be connected to the layer. See the chapter Reference Data Mode for more information on reference curves.
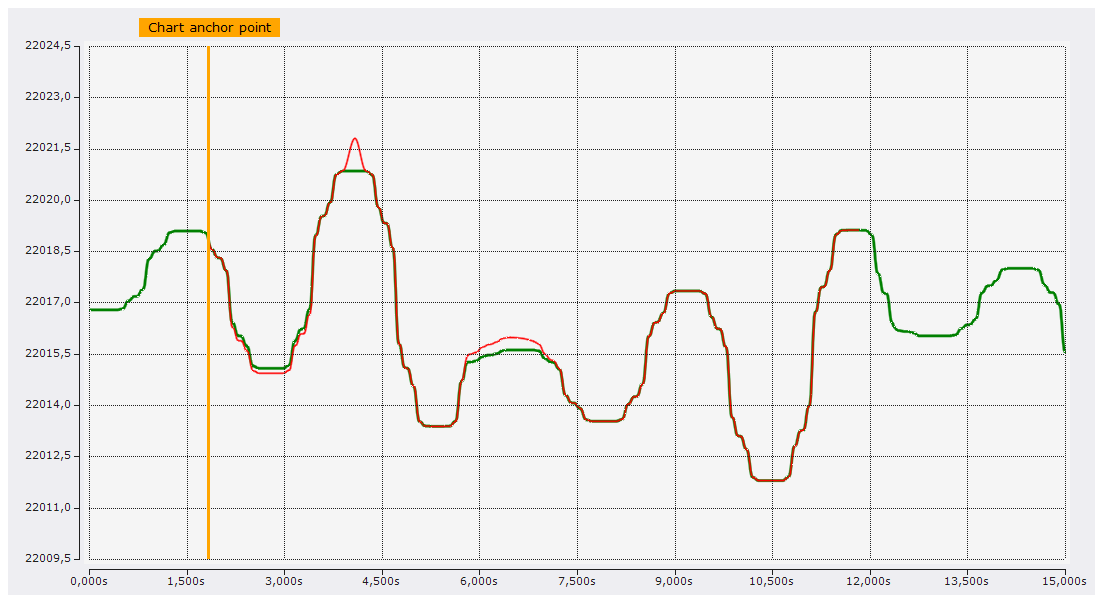
The screenshot shows the channel in green, which is below the chart as usual. The red curve shows a layer containing a reference curve. This reference curve starts at the anchor point of the chart, which is indicated by the marker, and is then drawn over a length of 10 seconds, since the reference curve contains 1000 data points and these data points are interpreted with a sampling rate of 10 ms.