Layer Editor
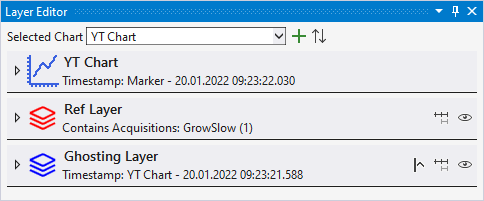
In the Layer Editor, which is integrated as a tool window in Visual Studio, all settings for the layers are made. The editor is divided into three areas.
General settings

The upper area contains general settings. On the one hand, the chart to be edited can be selected there. Use the plus  to add new layers and the arrows
  to sort the existing layers. Here, the layers are sorted in ascending order according to their data starting point.
Chart settings
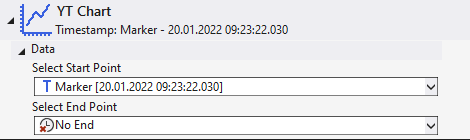
The middle area includes all settings related to the selected chart. These are the settings of the anchor point. In addition to the anchor point at which the drawing of the graphs begins, an end point can also be defined. The end point specifies the time up to which the graphs are to be drawn.
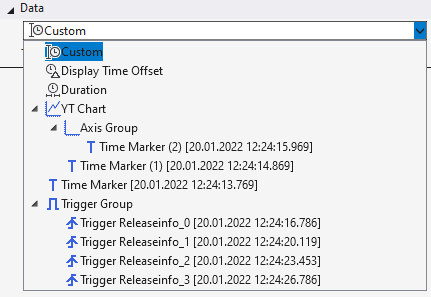
The following options can be selected to set the point in time.
Custom
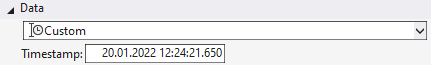
If Custom is selected, a fixed timestamp can be entered for Timestamp.
Display Time Offset
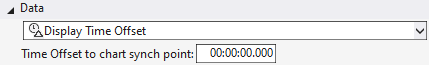
This setting can be used to configure a dynamic time. The adjustable time is an offset which is added to the current position on the chart to calculate the time of the anchor point.
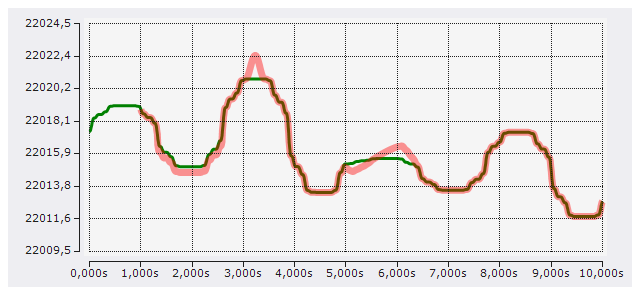
The screenshot shows a configuration where a Display Time Offset of +1 s has been set in the chart, resulting in the reference curve starting at one second.
Duration
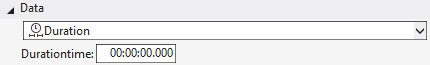
The Duration setting is another dynamic time configuration. With this configuration, the point in time is determined anew every x time units. X is the time that can be configured in the window. The recording start time forms the first point in time. From then on, the associated timestamp is always the recording start time plus a multiple of the Duration setting. During recording, the timestamp jumps by one duration every x time units and after recording, the timestamp is at the last possible time.
Charts
When linking to a chart, the linked timestamp is always linked to the current position of the selected chart.
Time marker
If a timestamp is linked to a time marker, the timestamp is always set to the time of the marker.
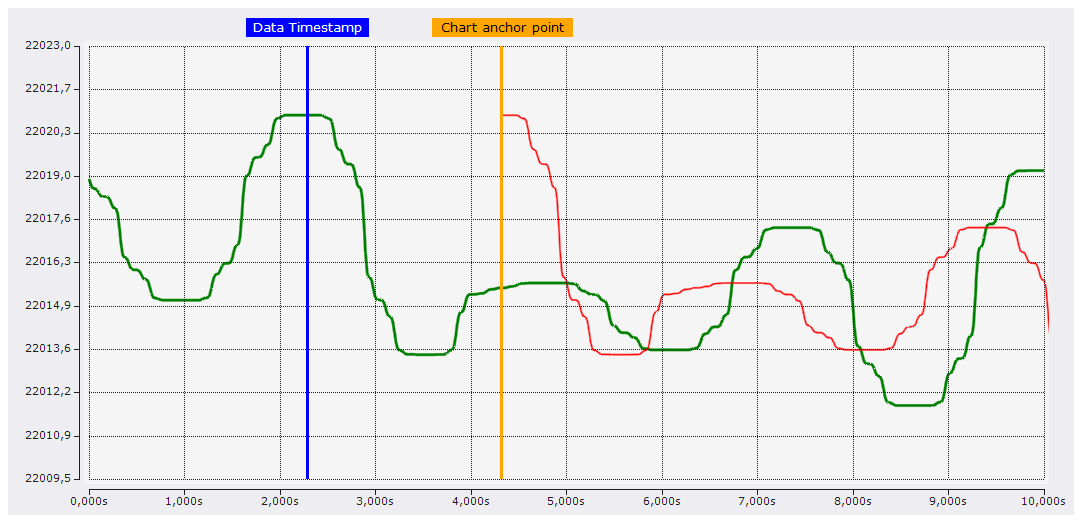
In the configuration shown in the screenshot, the anchor point is connected to the orange marker and the layer is connected to the blue marker. With this configuration option, the connected timestamps can be easily and accurately set to the appropriate time.
 | If a marker is set to the correct position, it is recommended to lock the marker (set the marker's lock property to true) so that it is not accidentally moved on the chart. |
Trigger Group
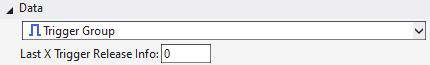
With the selection of a trigger group, the timestamp is also updated dynamically again. With this configuration, the associated timestamp is always set by the trigger events that occurred in this trigger group. With the adjustable number you can still set which trigger event should be used. Here, the count is always from new to old. If the counter is set to 0, the timestamp always represents the time of the latest trigger event. If the trigger is set to 1, always the penultimate, etc.
Trigger Release Info
For Trigger Release Info, a trigger event can be explicitly selected to set the associated timestamp to the time of the event.
Set end point
The end point of a chart can be set using the same functions as the anchor point. Only the Duration function at the end is replaced by the Layer Length setting.
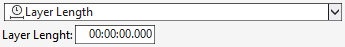
A fixed Layer Length can be set here.
Layer settings
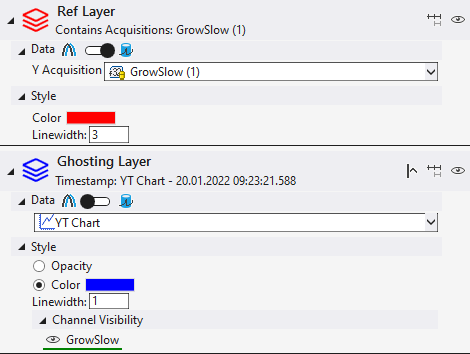
The third and lower area of the editor contains the settings of the layers. Each layer gets its own area so that all settings can be made there.
The settings are again divided into different areas.
First there is the layer header:

In the layer header the most important information is shown on the left and on the right there are buttons for configuring the layer.
 Setting the visibility of a graph before the anchor point. If this setting is activated, data of a ghost graph will be drawn even before the anchor point, if data are already available for the time range. If the setting is deactivated, the layers only start at the anchor point.
 This toggle button is used to enable/disable the Echo mode.
 Turn visibility of the layer on and off.
The Data setting area is a dynamic area, which is structured differently in the various modes and is therefore explained further there.
The third area is for configuring the style of the graphs that are displayed in the layer.
- Opacity - With this setting the colors of the original channels are adopted for the ghost graphs and adjusted in opacity. Thus, the different graphs can be easily assigned to each other and still be distinguished. Since there are no associated channels for reference curves, this setting is only available for ghost layers.
- Color - The color selected here will be set for all graphs of the layer.
- Linewidth - The graphs of this layer will be drawn in the specified line width.
- Channel Visibility - If not all channels are to be displayed for ghost layers, the individual ghosts of the channels can be hidden.