Echo mode
If data is to be compared which recurs in a fixed cycle, the use of an echo layer is recommended. This layer consists internally of x further layers, where the data output point is always shifted to each other by a definable length. If the defined length is configured to the cycle length, the data output points of the layers in the echo layer always have a distance of one cycle length. Thus, the past cycles can be easily superimposed.
From the mode of operation, the echoes build on the use of the Duration setting of the data settings. The first layer always has the current data starting point. However, it always has only the second newest possible value for the duration calculation, so that a full frequency of data is always available for the echoes.
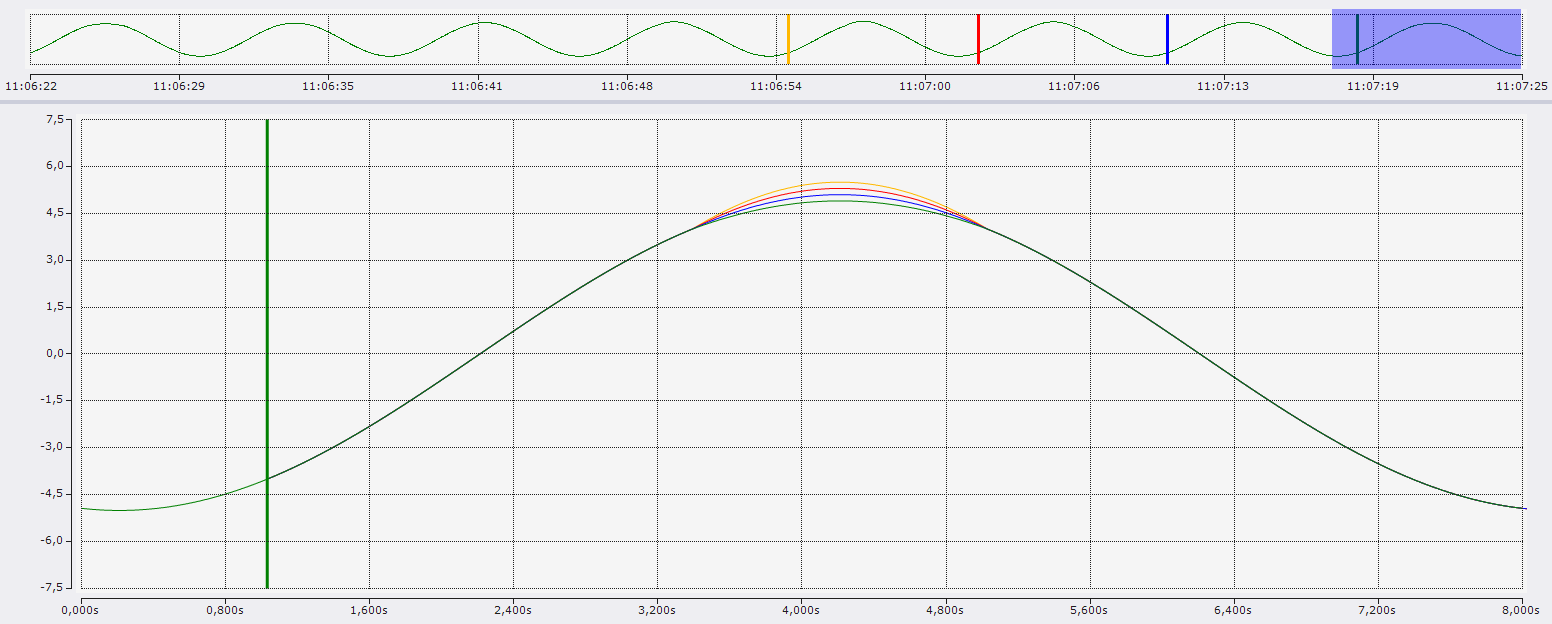
The screenshot of the scope shows the echo mode using the example of a curve with a frequency of eight seconds. These eight seconds are also displayed as Duration length in the chart with this configuration. The current anchor position of the chart is marked with the green marker in the screenshot. From there, all three echoes are drawn in the echo layer. The data output points of the echoes are represented by markers in the same color in the overview chart. The blue marker belongs to the first echo layer, which can be seen as a blue graph in the chart. This time is eight seconds before the anchor point of the chart. Another eight seconds before that is the red marker representing the data output point of the second echo, which is represented in the chart by the red graph. The orange graph belongs to the third echo, which is represented by the orange marker in the overview chart and is also eight seconds before the red marker (2nd echo).
The display with the echo mode can be optimized during recording by using the Restart Display Trigger in conjunction with the Time Trigger.
For configuration, the Clear Display function should be activated for the Restart Display Trigger and the Time Trigger Set should be set to the duration length. With this configuration, each time a new duration is started, the chart is cleaned up and the echoes load the data from the past durations. Then the charts are filled with new data, so that the new data gradually overlays the echoes.
Settings
To activate the echo mode, it  must be activated in the header.
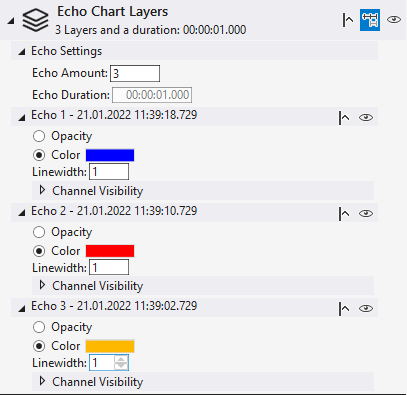
Echo Settings:
- Echo Amount - number of echoes in this layer
- Echo Duration - length of the frequency. If Duration mode is selected for the anchor point at the chart layer, the frequency cannot be set in this layer because the length is taken from the chart.
The appearance of the echoes can be configured in the same way as the other layers.
 Setting the visibility of a graph before the anchor point. If this setting is activated, data of a ghost graph will be drawn even before the anchor point, if data are already available for the time range. If the setting is deactivated, the layers only start at the anchor point.
 Turn visibility of the layer on and off.
- Opacity - With this setting the colors of the original channels are adopted for the ghost graphs and adjusted in opacity. Thus, the different graphs can be easily assigned to each other and still be distinguished. Since there are no associated channels for reference curves, this setting is only available for ghost layers.
- Color - The color selected here will be set for all graphs of the layer.
- Linewidth - The graphs of this layer will be drawn in the specified line width.
- Channel Visibility - If not all channels are to be displayed for ghost layers, the individual ghosts of the channels can be hidden.