TwinCAT 3 Bode Plot - first steps
In order to enable you to get up and running quickly and to simplify work with the TwinCAT 3 Bode Plot, the first steps towards a Bode Plot recording are briefly summarized on this page.
If you wish to create a Bode Plot for a TwinCAT CNC axis, note the instructions for configuring TwinCAT CNC axes at the end of the section.
| |
Risk of injury due to the drive axis starting up automatically To create the Bode Plot, the drive axis performs a motion sequence that depends on the settings. At the start of the recording the drive axis starts up automatically in accordance with the set motion profile and can endanger people and material. During the recording the drive axis remains integrated in the application context (e.g. enables, monitoring, etc.).
|

For a basic understanding it is important to know that the TwinCAT 3 Bode Plot is part of the Measurement installation, which also includes the Scope View and the Scope Server. Some functions are used across Measurement installations. For example, the toolbar controls both Scope and Bode projects. Since all Measurement projects use the Scope Server for the recording of the data, this is always installed as well. However, it can also be installed individually on a target device via the component installation.
- For the Bode Plot, the “Base” license is initially activated, irrespective of whether it has been installed via its own Measurement setup or via the TwinCAT 3 XAE setup.
- 1. Create a new project and select the preconfigured Bode Project from the available Measurement templates.
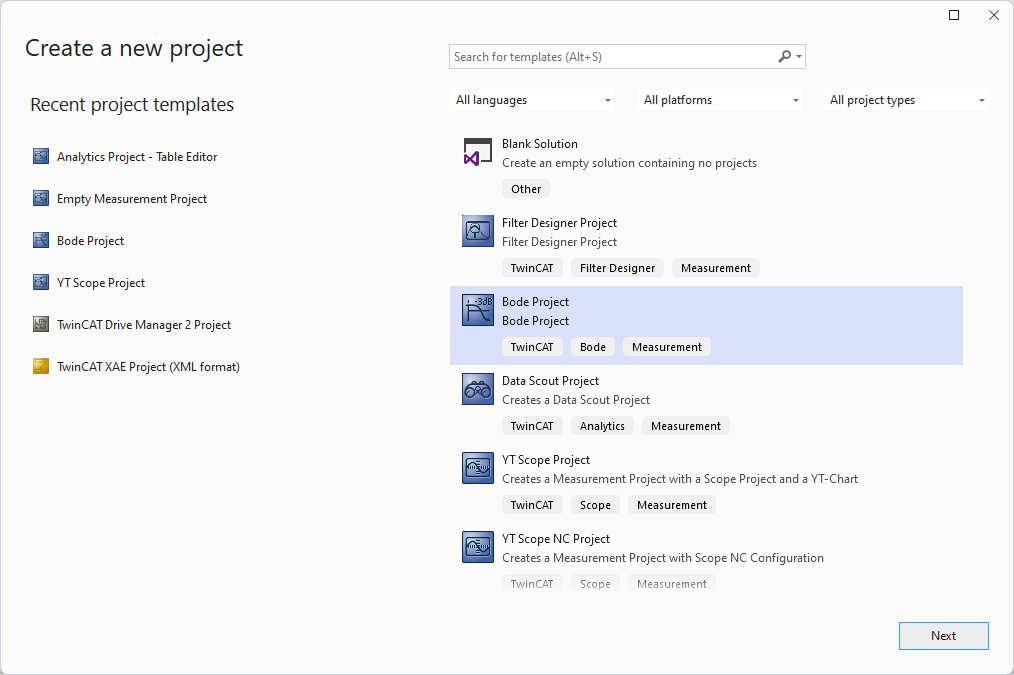
- 2. A solution with a project tree opens in the Solution Explorer. The Bode Plot can be found at the lowest level.
In the Properties window, set the Axis ID and Target Net ID for the drive axis for which the Bode Plot is to be created.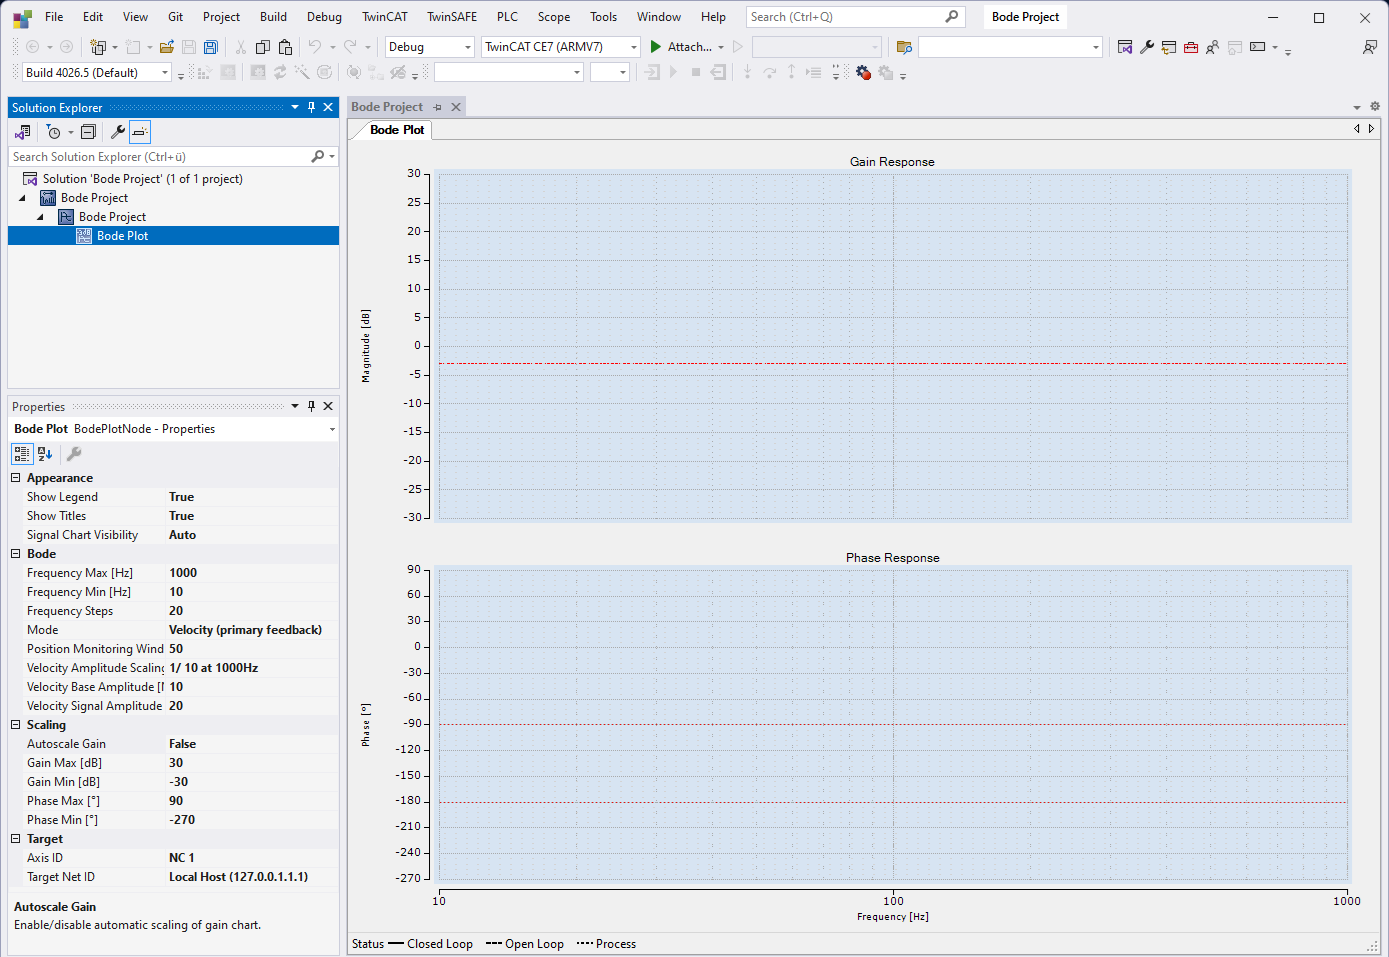
- 3. Before you can perform the actual recording for the Bode Plot, you must adjust the settings in the TwinCAT project once.
The Bode Plot is executed in the TwinCAT system by a TcCOM object. To ensure that this can be generated automatically from the Bode project, you must register the Class Factory for TcBodePlot and TcNcObjects.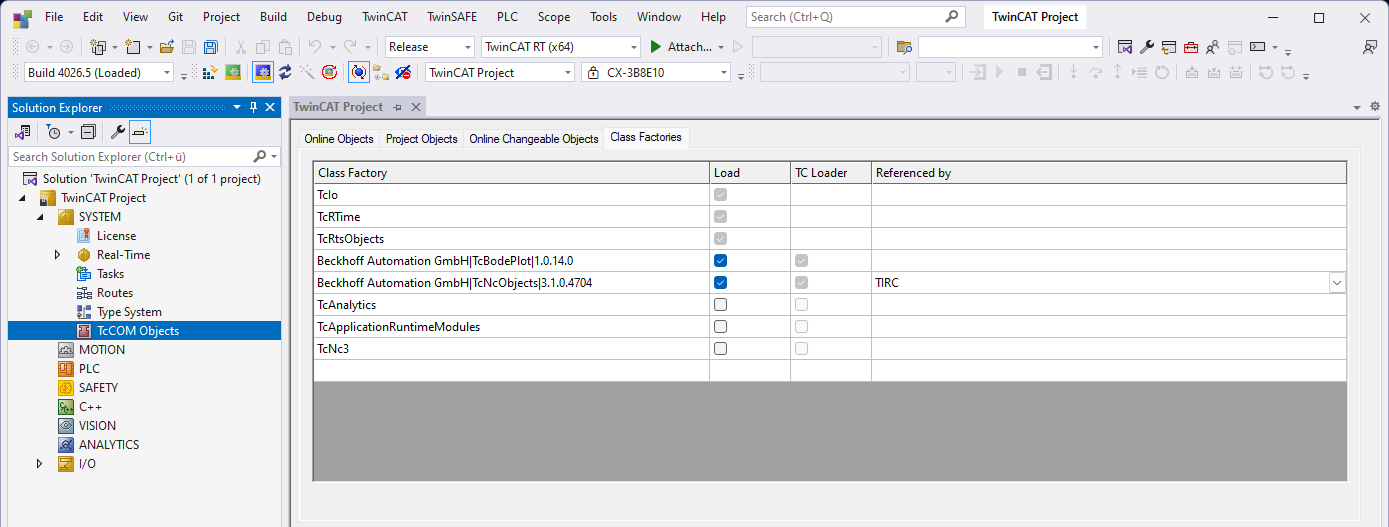
- 4. For dynamic communication with the drive, reserve a single memory area per EtherCAT device—known as a “Dynamic Container”—on the EtherCAT master.
Confirm the subsequent dialog for querying the container size with OK. When using TcAutotuning, which is based on the Bode Plot, a container size of 512 is required.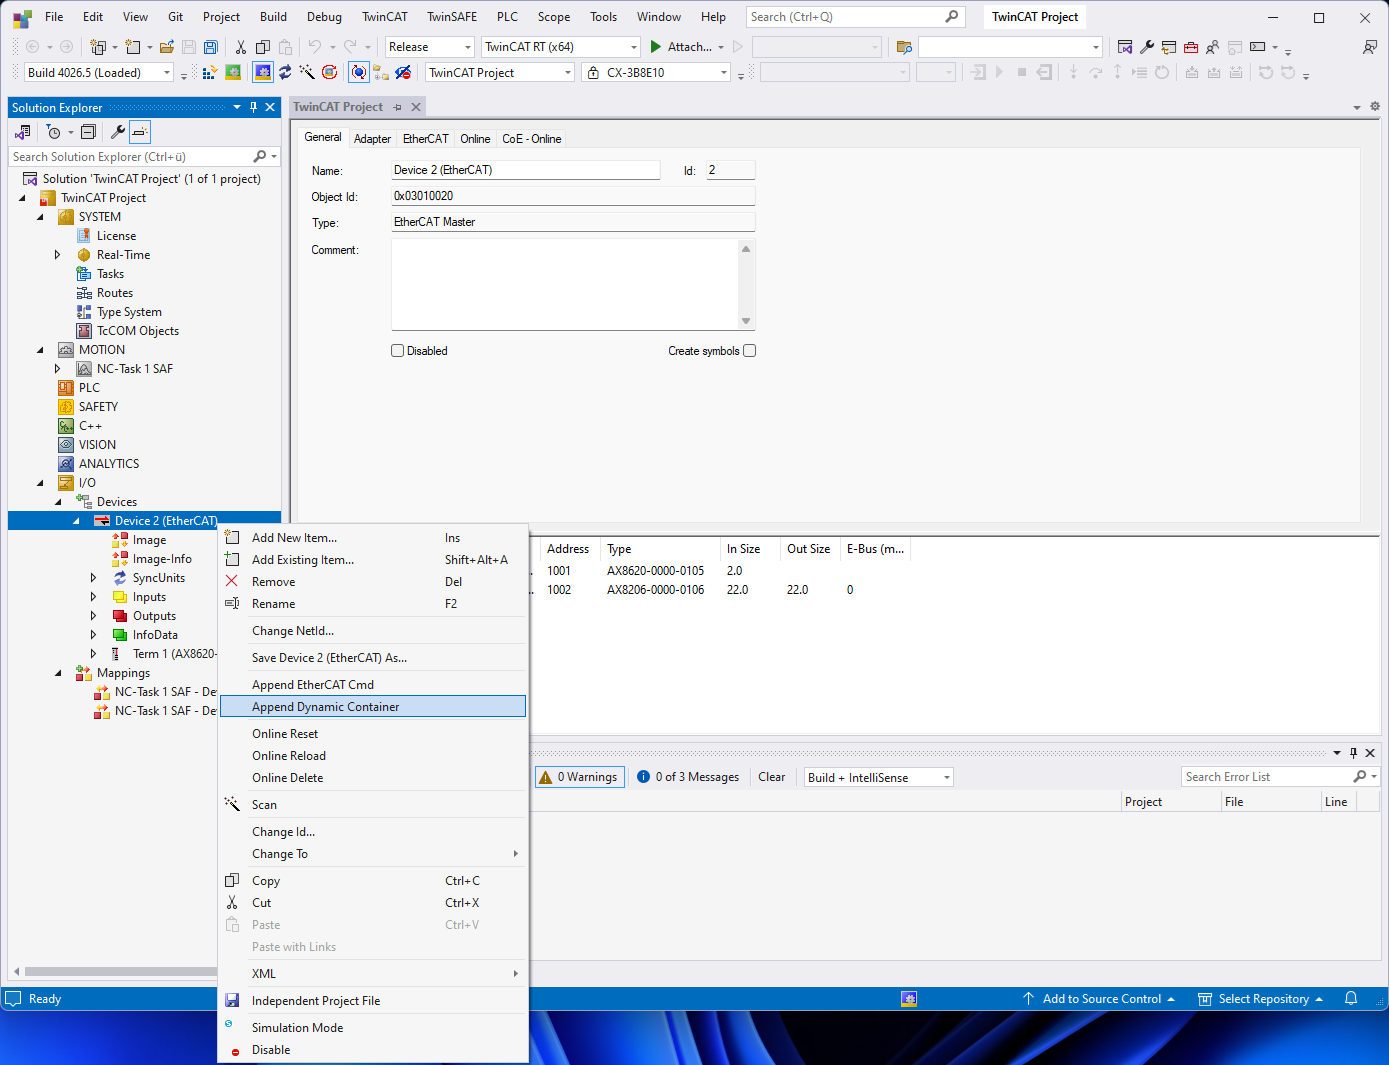
- After having selected the target system and the drive axis, you can parameterize the recording in the Bode Plot properties. The details for the settings can be found in the section "Bode Plot – plot properties".
- 5. The Bode Plot is started with the Start Record button in the Measurement toolbar. During the recording the current time signals are displayed below in the plot. You can abort the recording at any time with the Stop Record button.
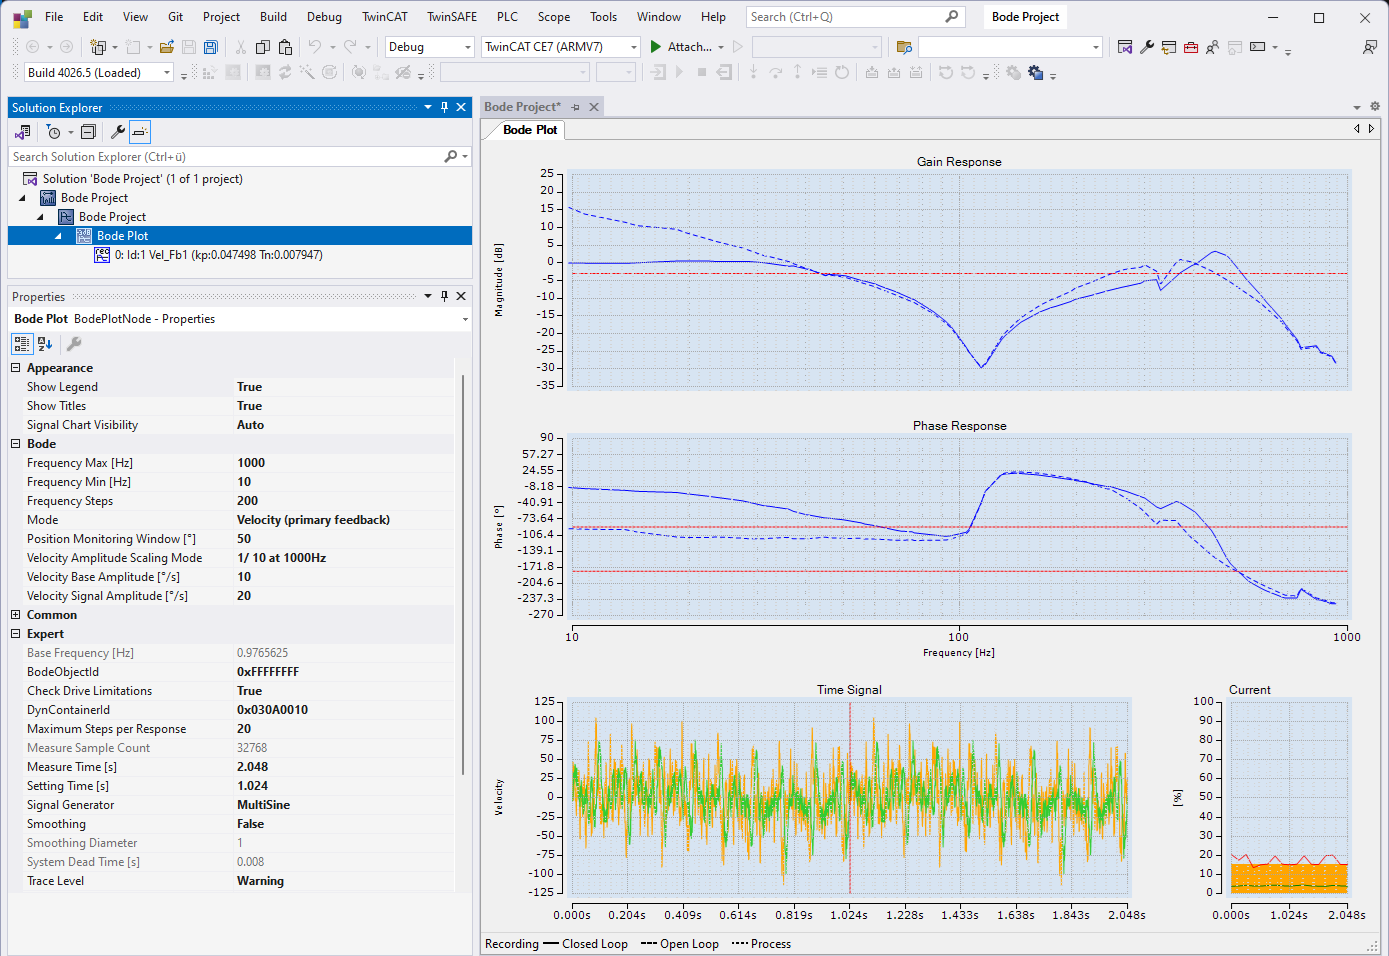
- If errors should occur during the recording, they are displayed in the Error List of the TwinCAT XAE Shell (or Visual Studio). For example, the Bode Plot reports a missing axis enable or the absence of a Dynamic Container when attempting to start the recording

- However, the Error List only displays the errors output by projects that are part of the active solution.
Example: If a lag error is signaled for the drive axis and the project is not part of the active solution, a general Bode Plot error is output.
If the project is part of the active solution, then the lag error is also output in the Error List. - Following the recording you can see all the characteristic curves created so far.
- 6. You can change the display options in the Properties. For example, it may be useful to view the "process" as well as the "open loop" and "closed loop" (see Open and closed loops), or to highlight or mask individual characteristic curves. For details on the settings, see the section“Bode Plot - set properties.”
In addition, you can also add Filter Sets to simulate filters or Result Sets to determine superposition results.
Using markers makes it easier to read and compare the results.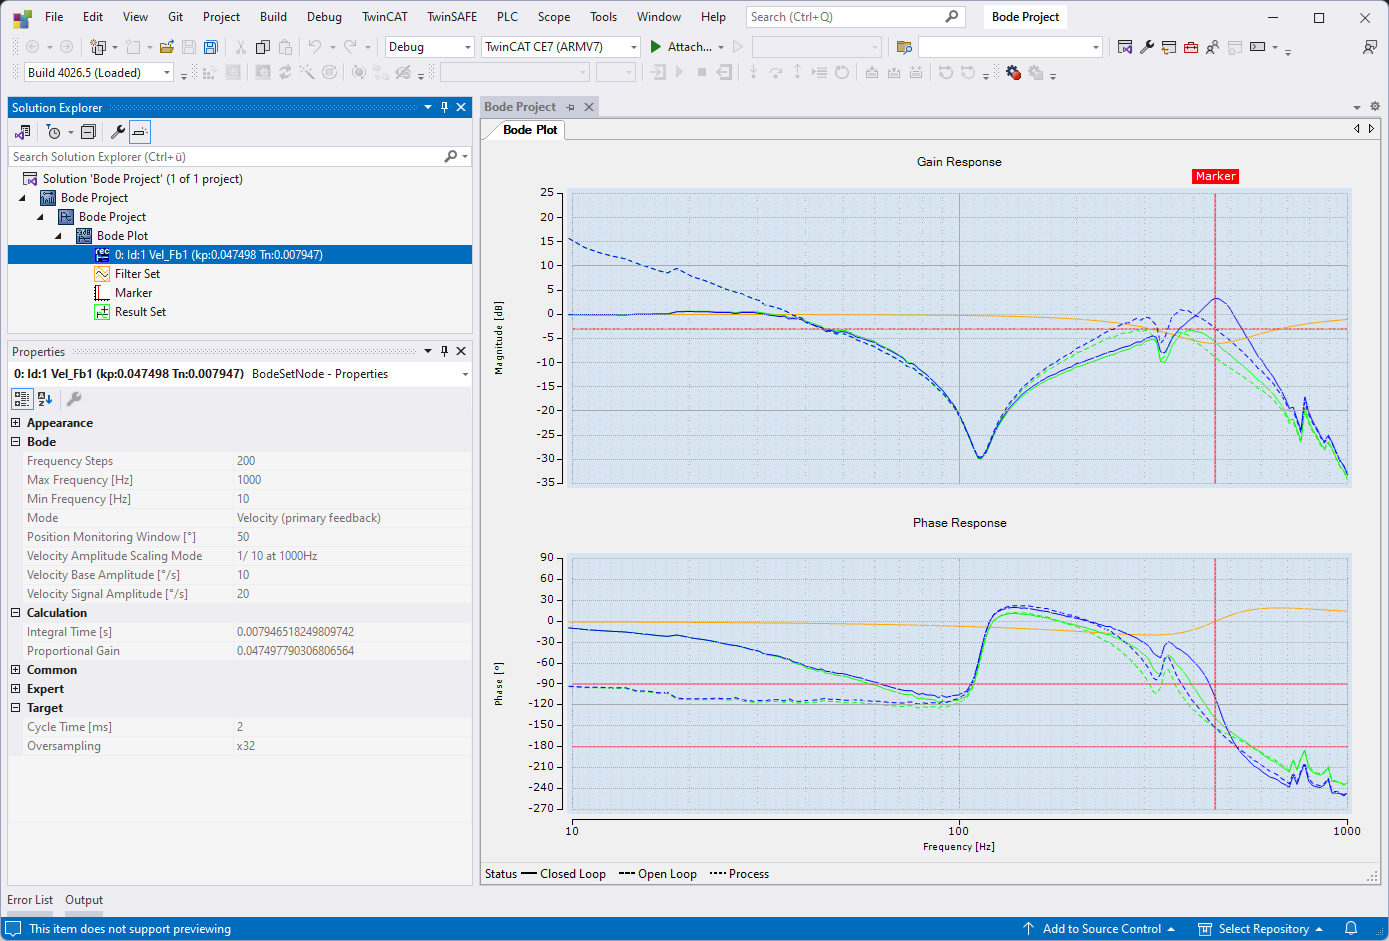
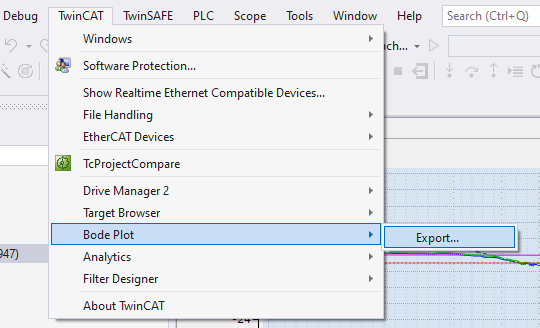
- 7. After recording and analyzing the frequency responses, you can export the data. You can launch the Measurement Export Wizard from the TwinCAT menu.
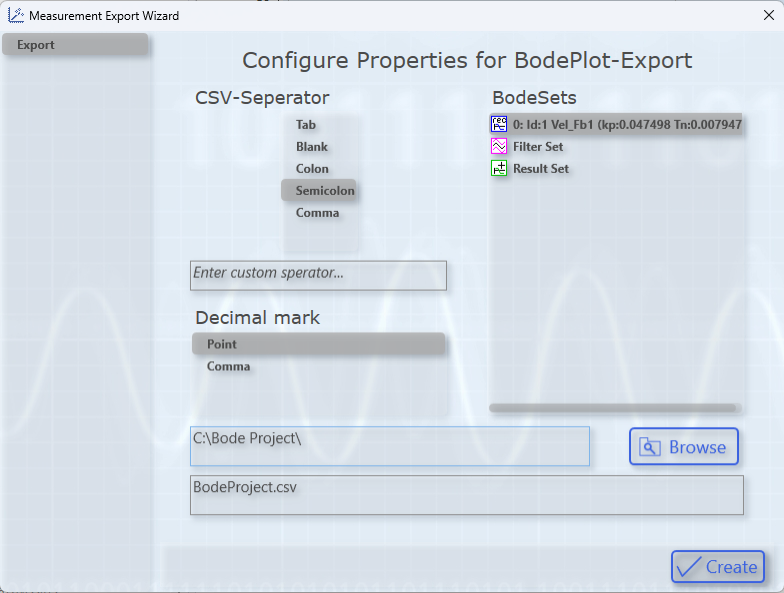
- 8. In the following window, you have the choice of which Bode elements you want to export and can configure basic settings for the CSV format.
- You have now created a Bode Plot.
Notes on the configuration of TwinCAT CNC axes
If a Bode Plot recording is to be generated for a TwinCAT CNC axis, the matching speed standardization f must be set for that axis in the axis parameter set.
Based on the AX5000’s internal speed scaling (1 increment corresponds to a speed of 5.588 × 10⁻⁵ rpm), this is calculated using the following formula:
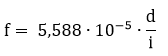
With
f: scaling factor [µm/min] or [10-3°/min]
d: feed per motor revolution [µm/rev] or [10-3°/rev]
i: gear ratio [-]
The resulting factor must then be entered in the axis parameter set for the respective axis. This is done by means of the parameters P-AXIS-00205 - P-AXIS-00207.
Example:
Linear axis with 5 mm feed per motor revolution and gear ratio 4.

This results in the following axis parameters:
antr.v_time_base | 0 | (P-AXIS-00207: time base = 1/min ) |
antr.v_reso_num | 100000 | (P-AXIS-00206: standardization factor counter) |
antr.v_reso_denom | 6985 | (P-AXIS-00205: standardization factor denominator) |
For more information on axis parameters, see the Beckhoff Information System:
TF5200 | TwinCAT 3 CNC Axis Parameters