Bode Plot principles
The Bode diagram is a special representation of a complex transfer function or of a system in the frequency range. The Bode diagram consists of a graph for the value (amplitude response) and a graph for the phase shift (phase response). It describes the stationary reaction of the system to a harmonic excitation (sinus oscillation). The frequency is displayed logarithmically on the X-axes. As a result, the behavior over a wide frequency range is visible at a glance.
In a servo system, it is possible with the help of the Bode diagram analysis to analyze the behavior of the closed and open control loops, as well as the transmission link (e.g. the connected mechanism) and to make or optimize controller and filter settings. In general, this can take place in the typical operating modes - current, speed and position control - and can also serve as the basis for automatic tuning algorithms. There are currently two variants in TwinCAT - current and speed control.
Conventional methods, such as optimization to a step response, are usable only to a limited extent. The Bode diagram contains much more information than the step response and is thus the ideal tool for the analysis and optimization of control loops.
- The system performance and stability over the entire frequency range are directly visible (accuracy in the rest position - in the lower frequency range; the dynamic reaction - in the mid frequency range; noise suppression - in the upper frequency range)
- A bandwidth can be specified more simply and more precisely without disruptions due to noise effects
- Problem frequencies (mechanical resonance points) are simpler to analyze
- Filters can be determined and adapted accordingly
What generates resonances in a drive train?
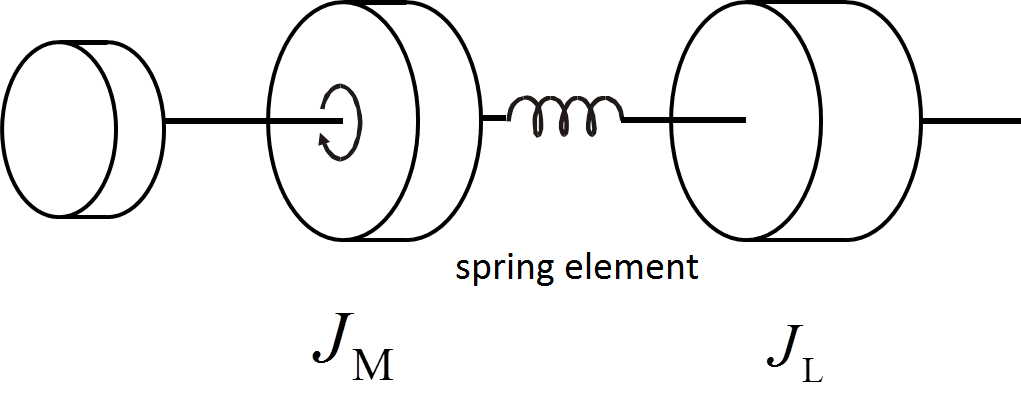
Each coupling between load and motor has a finite rigidity. This leads to different inertia ratios and different resonant frequencies of the complete system. These different frequencies are difficult to determine without a suitable tool. The frequency analysis can be performed with an almost infinitely fine graduation in order to reliably detect all resonance points.
Mechanical friction must be eliminated during the measurement procedure, otherwise the measurement will be useless. Therefore, to overcome the static friction, a sine oscillation with a constant low frequency is additionally applied to the motor shaft. Sine frequencies, increased step by step, are modulated in this manner. To ensure that the motor current remains more or less constant in speed (and position) control, the amplitude of the sine oscillations decreases as the frequency increases. The actuating amplitudes are thus very small at high frequencies. The current in the Bode Plot is constant.
Bode diagram
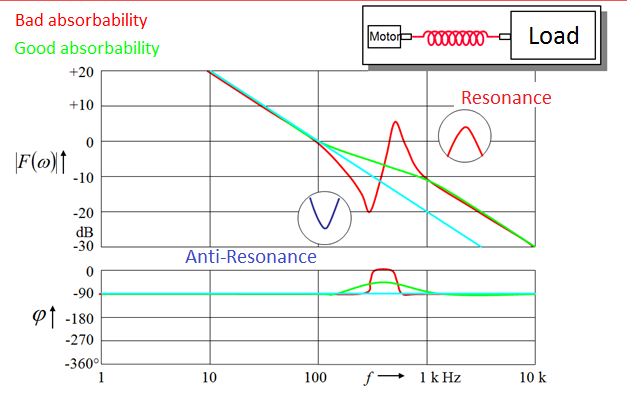
Resonance points are represented in a Bode diagram. In the representation, a resonance point consists of an anti-resonance (frequency response exhibits a pronounced minimum) and a resonance (frequency response exhibits a pronounced maximum).
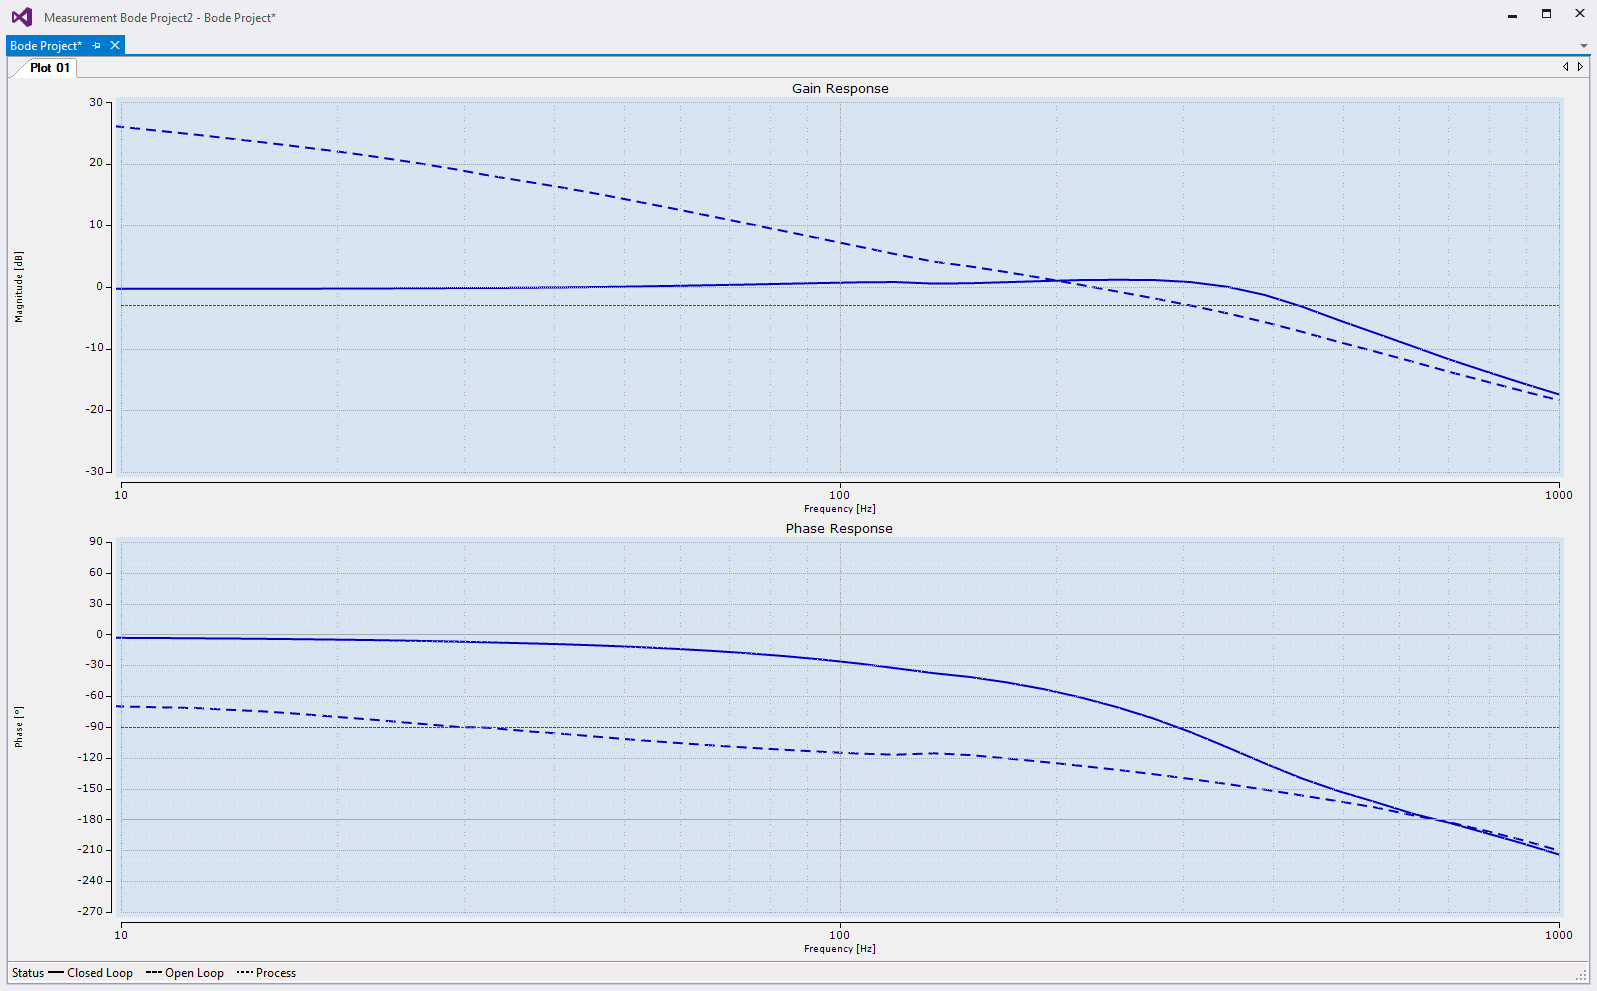
The following illustration shows an example of the frequency response of a motor with no load, no resonance points and quite a wide bandwidth. The closed control loop is uses for the determination of the bandwidth, while the open control loop is regarded for calculating the amplitude response. The bandwidth is read where the amplitude response first crosses the -3 dB or the -90° line. The higher the bandwidth of a system, the more stable it is and the higher the control loop gain can be set. This result in high dynamics.
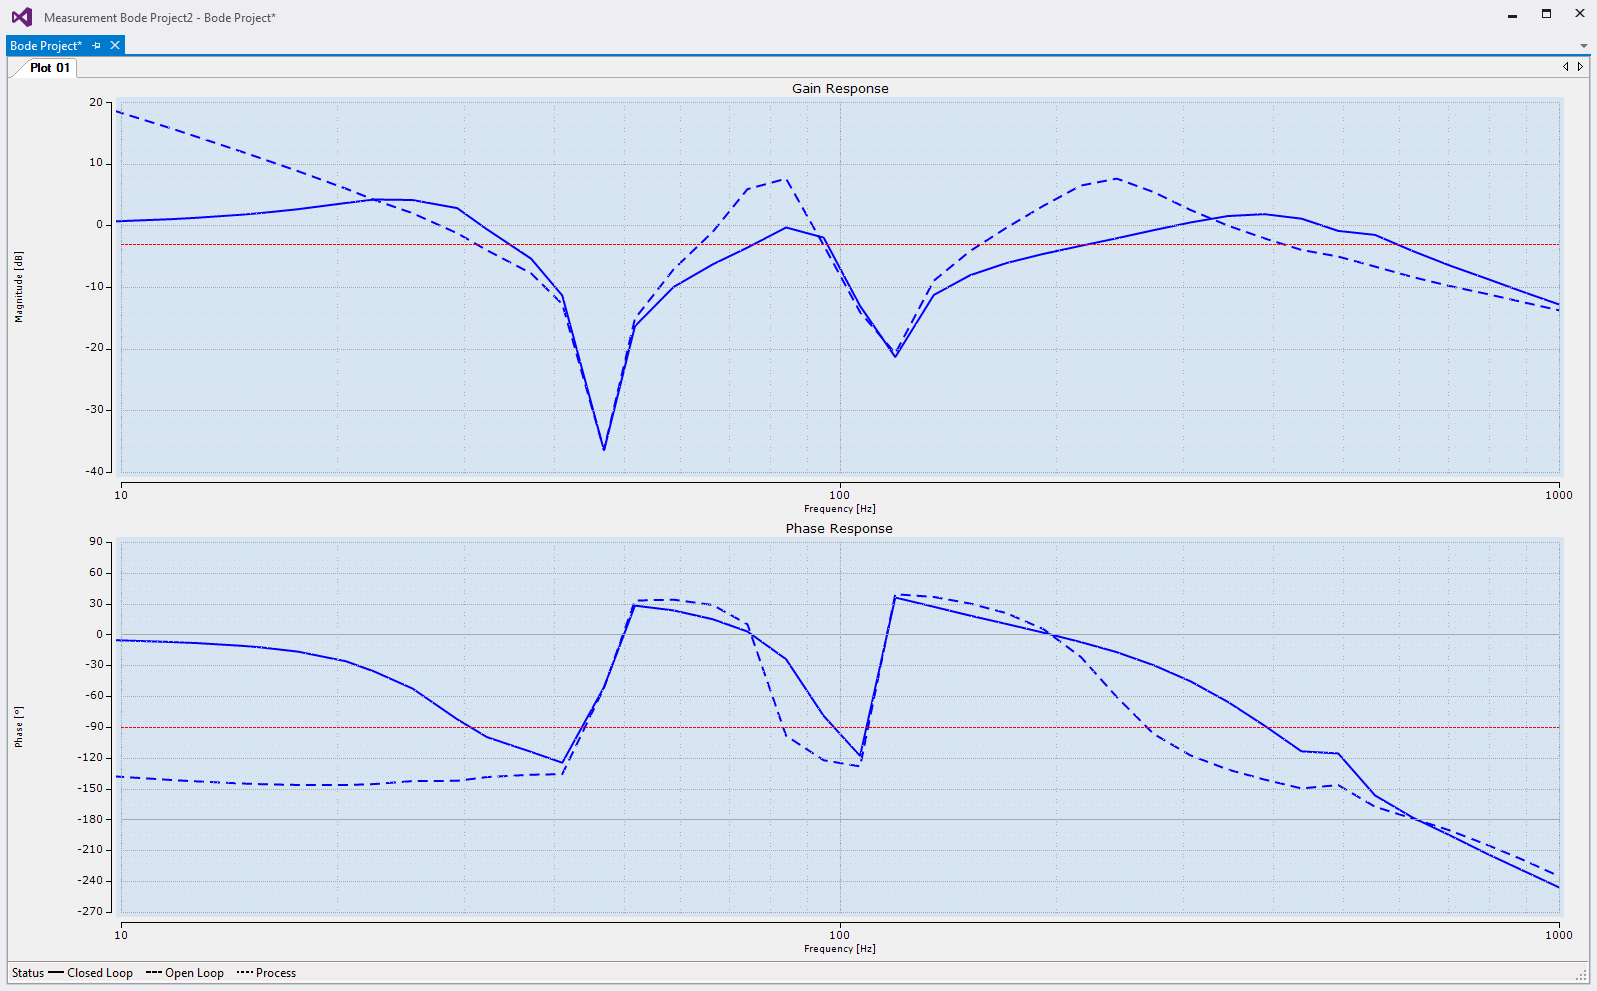
A typical curve with resonance points is shown in the next diagram: a curve with two resonance points and narrow bandwidth.
The second important limit is the +3 dB line. If the amplitude response of the closed control loop exceeds this limit, this is referred to as positive feedback, analogous to audio (speaker with microphone close to the loudspeaker).
This positive feedback generates an undesired mechanical oscillation, which can lead to uncontrolled behavior.
By increasing the P portion (proportional gain), the curve is shifted upwards in parallel to the abscissa; a reduction has the opposite effect.