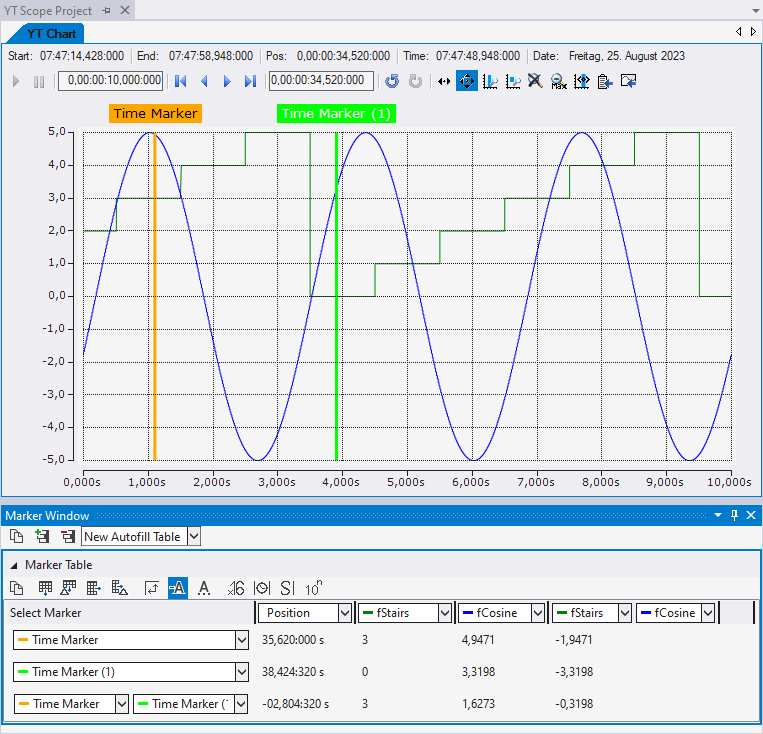
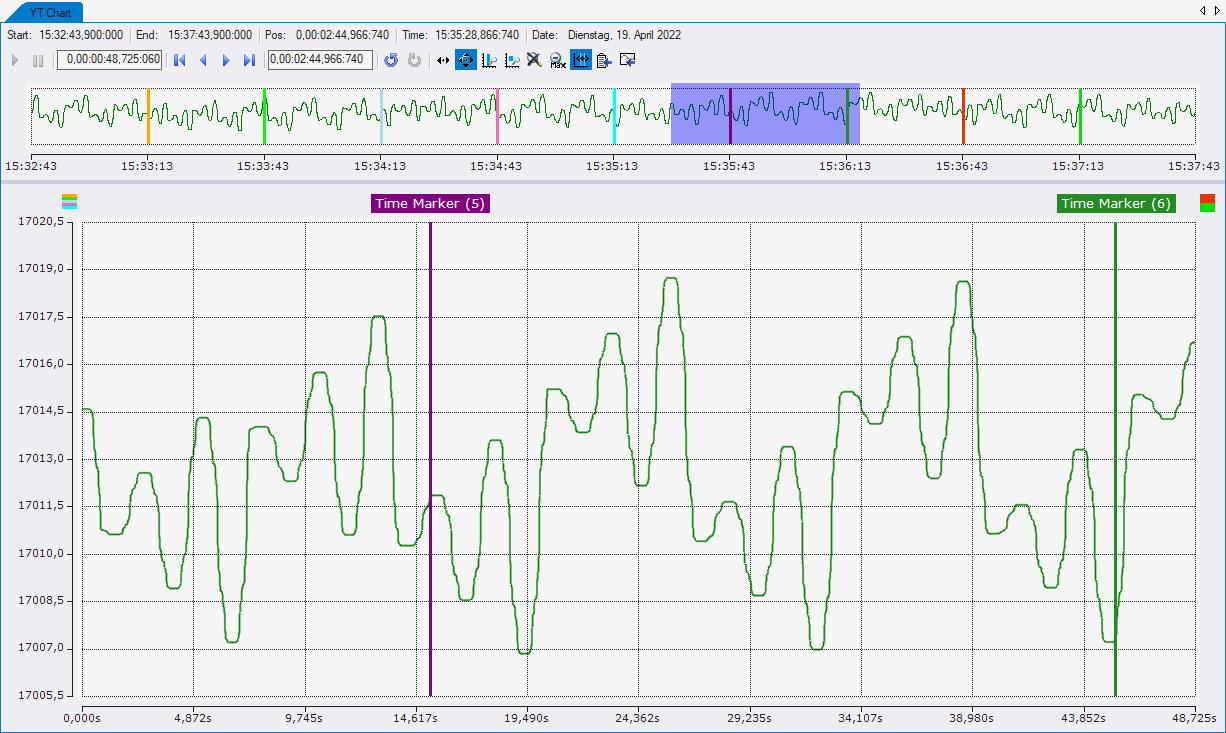
Markers
A marker is a chart element that can be docked to an axis. The marker consists of a line that can be found in the chart and a text field that appears alongside the chart and displays the name of the marker.
On clicking on the marker, a tooltip appears that displays the position next to the name.
If the marker was added to a time axis (YT chart) or an index axis (array bar chart and single bar chart), the values of the channel appear in the tooltip.
The values of the different markers can be viewed in the marker window and compared with other markers.
A marker is added via the context menu of a project, a chart or an axis group.
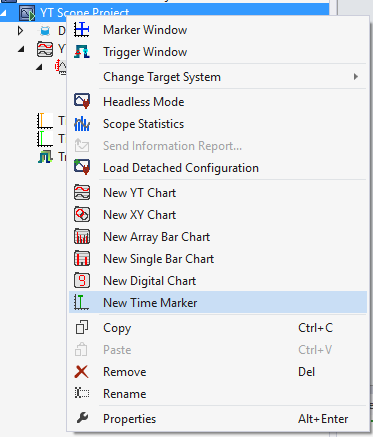
Furthermore, a marker can also be created on a data point via the context menu in the chart.
All the properties of a marker are explained here.
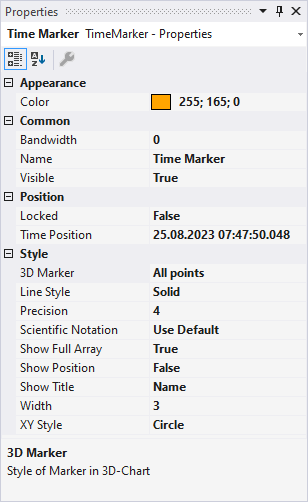
Appearance
Color | Color of a marker. |
Common
Bandwidth | Width of the rectangle behind a marker. Specification indicates the width from the marker to the edge of the rectangle. The value of the specification is identical to the input of the position. |
Name | The name of the marker is the same as that displayed in the project tree and, depending on the "Show Title" setting, this value can also be displayed in the text field above the chart. |
Visible | Setting whether the marker should currently be visible or invisible. |
Position
Bind Axisvalue (only for time markers under a chart or axis group) | If this value is set to 'false', a percentage value can be entered in the "Position" setting. This means that the marker is always displayed in the current chart and the time can be calculated as follows: chart position + display width * marker position |
Locked | If Locked is set to false the marker can be moved freely within the chart with the mouse. |
Position | Position of a cursor. The absolute value of the axis is entered here for value and index axes and the percentage value or absolute timestamp for time axes. |
Style
3D Marker (only for markers below the project or a 3D chart) | The display of a marker within a 3D chart is made up of 5 components, which can be freely combined with each other:
|
Line Style | This setting can be used to set the line type of the marker. |
Precision | Precision of the display values. |
Scientific Notation | Specifies whether the value is displayed in scientific notation in the tooltip and Marker window.
|
Show Full Array (only for time markers) | Specifies whether all values of an array or only a specific value is displayed in the tooltip and Marker window. If only a specific value is to be specified, a position can be specified in addition to the time position. |
Show Position | If this is selected, the position is also displayed in the marker label. |
Show Title | This setting can be used to configure which text is displayed above the chart in the marker.
|
Title | Specifies the text that can be displayed in the marker. |
Width | Specifies the width of the marker line in pixels. |
XY Style (only for markers below the project or an XY chart) | The display of a marker within an XY chart can be configured in different ways:
|
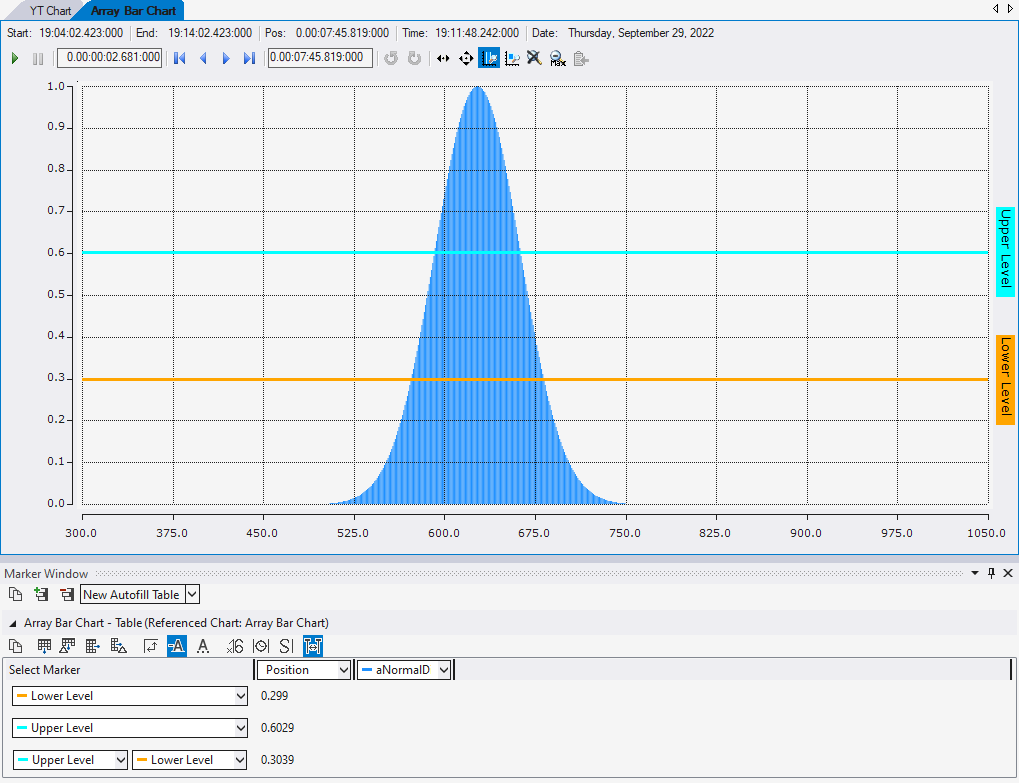
Marker Window
In the Marker Window, channel values from the times of markers or trigger events (timers) can be output and compared with other timer values. A Marker Window always refers to the project selected in the Solution Explorer.
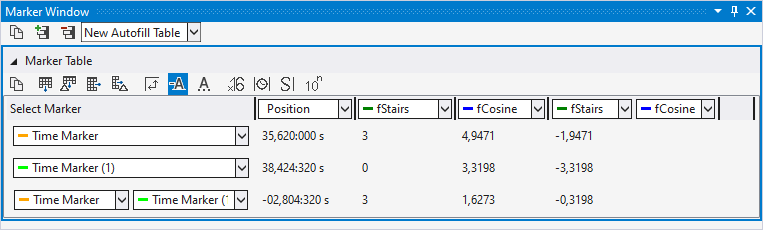
The Marker Window consists of a menu bar and an arbitrary number of tables. The tables can be freely created and also deleted again.
The menu bar at the top edge of the Marker Window contains the following buttons:
- Copy: Copies all values from the Marker Window to the clipboard so that they can be pasted into another program.
- Add table: Adds a new table.
- Delete table: Deletes the selected table.
- At the side of the buttons there is also a selection box in which all charts existing in the configuration are listed. If a chart is selected there, an automatic table is created containing all markers and channels that refer to the chart.
All tables are pictured below one another under the menu bar. The values of the various channels at the different times of the timers are displayed in a table.
There are two different options for the rows and columns.
- Option 1: Select one timer / channel; in this case only the value of one time/one channel is output.
- Option 2: Select two timers/channels; in this case the difference between the values is calculated.
If two timers and two channels are selected, the difference is calculated between the 1st channel and the 1st time (position) and between the 2nd channel and the 2nd time (position).
The following buttons are available for the configuration of the table:
- Copy: Copies the values from the table.
- Add row: Adds a row with a single selection option.
- Add difference row: Adds a row with a double selection option for a difference.
- Add column: Adds a column with a single selection option.
- Add difference column: Adds a column with a double selection option for a difference.
- Rotate orientation: The orientation setting button lets you define whether the timers or channels are in columns or in rows.
- Colored marking: In order to be able to assign markers and channels not only on the basis of the names, small lines can be displayed in front of the name, which have the same color as the associated elements.
- Colored numbers: The data can be drawn in the table in the same colors as the color of the associated timer.
- Hex notation: The values are displayed using hexadecimal notation.
- Absolute time: The time is displayed as an absolute time.
- Unit: The units of the channels are also displayed in the table.
- Scientific Notation: If the Scientific Notation is set to 'default' for the markers, this setting can be used to overwrite the value for the display in the Marker window.
If the 'Components Highlight' setting is active in the options, the associated channels and markers can be highlighted in the diagram by clicking on a cell. If the value is set to 'Enabled', simply selecting the cell is sufficient. If the option is set to 'DoubleClick', a cell must be selected by double-clicking on it.
The context menu of a data point in the chart can be used to create new markers, move markers or jump to the marker with the chart.
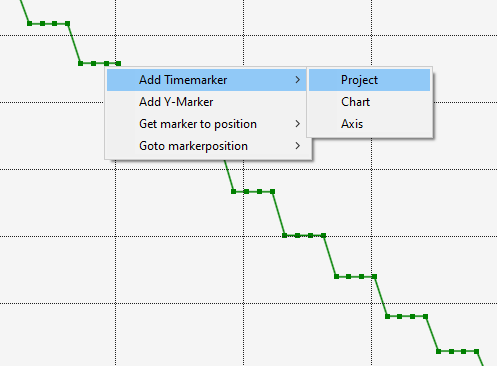
For the different markers there are different entries in the context menu for adding the markers.
First, a time marker can be added at the location of the clicked data point using Add Timemarker. Since time markers can be added under the project, chart and axis, this can also be selected at this point in the submenu.
The screenshot shows a YT chart. Therefore, time markers and Y-markers can be added there. The Y marker is added in the axis group where the channel is. This is comparable for charts that offer an X marker. Index markers can also be created and added.
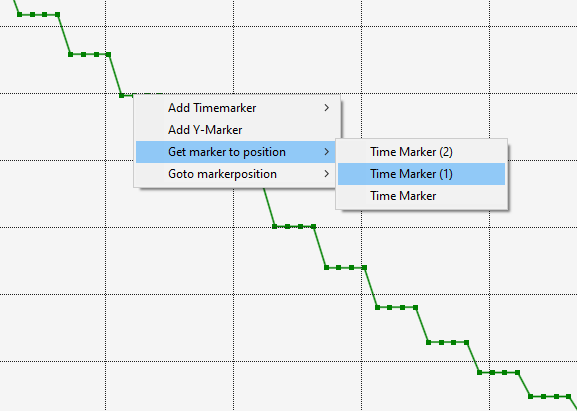
The menu entry Get marker to position can be used to move a marker that already exists in the project to the position of the data point. Here you can select all markers that are related to the selected channel. Thus, for example, markers from other charts fall out. The selectable markers must not be curly.
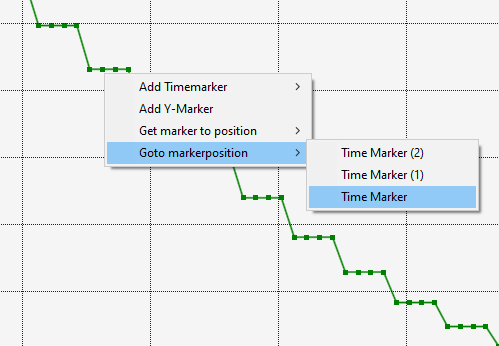
By selecting a marker in the submenu of the entry Goto markerposition the chart can be moved to the selected marker. Again, only the markers that are related to the selected channel are displayed.
If time markers are outside the currently visible time range, they are not visible. With the setting Timemarker outside the chart the markers can still be displayed.
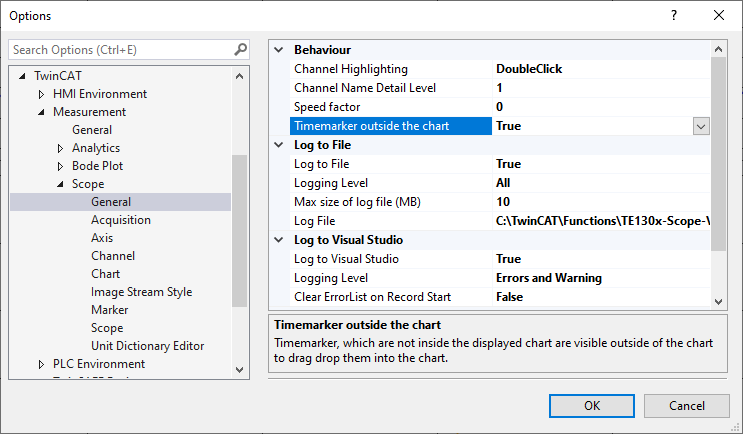
If the setting is set to True, the markers that lie outside the time range are displayed to the right and left of the data.
In the screenshot you can see the case where five markers are in front of the current chart position and two markers are behind the visible area. The five earlier markers are now displayed at the top left, above the Y-axis, and the two later markers are displayed at the top right. If the markers are not locked, the marker can be dragged and dropped from there to the current time range.
With a click on the markers, which are outside of the chart, you can jump to the current marker position.
Special marker functions for Array Bar Charts
In Array Bar Charts, Y-axis markers can be created in addition to X-axis markers. These can be added via the axis node in the Array Bar Chart through the context menu in the Solution Explorer. Most of the same functions and features are available as for the other markers. Clicking on the Y marker in the chart or in the Solution Explorer shows the corresponding properties in the Properties window.
Context menu
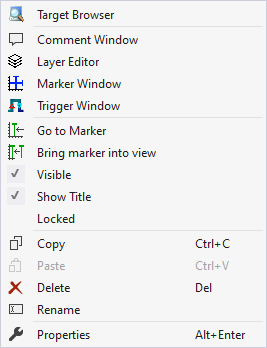
The first two groups contain the functionalities for opening various Windows tools. These include firstly the Target Browser, the Comment Window, the Layer Editor, the Marker Window and finally the Trigger Window.
Properties of the marker can be edited in the third group.
"Go to Marker"
If the marker is a time marker, the time position of a chart can be moved to the marker using this menu entry. If this function is applied to a project marker, all charts at that point in time are moved.
"Bring marker into view"
This function can be used to move markers into the visible area of a chart by resetting the time position. The marker is positioned in the center of the currently visible area. This only works with time markers that are connected to an axis. Depending on their position in the project hierarchy, there is a case distinction in the menu entries:
- The marker is below a chart or below an axis:
This function gives the marker a new position based on the position of the chart above it. - The marker is below the project:
If the marker is below the project, a chart in which the marker is to be positioned must be selected in a submenu for this function.
"Visible"
If this entry is active, the tick is visible on the left and the marker is displayed in the chart. If the entry is deactivated, the marker is not displayed in the chart.
"Show Title"
If the entry is active, a text field is displayed outside the chart in which the name of the marker is displayed.
"Locked"
This entry can be activated so that the marker cannot be moved freely with the mouse in the chart. The marker is then still displayed in the chart, but cannot be moved with the mouse.