Bar chart properties
Here you can enter all the settings relating to an array bar chart.
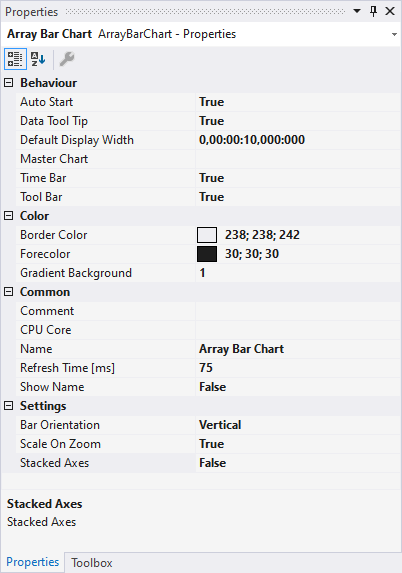
Behaviour
Auto Start | . If this option is enabled, the chart starts the live display when a new recording is started. |
Data Tool Tip | If this option is enabled, a click on a data point results in display of a tool tip with the exact values of the data point on the X- and Y-axis, plus the timestamp and name of the corresponding channel. |
Default Display Width | This time refers to the display times of the minimum and maximum values in the array bar chart. The extreme values are always recorded. The freely adjustable display time makes it possible to display an extended history of the extreme values. |
Master Chart | In the drop-down list that is available here, a chart that is part of the current configuration can be selected and designated as master chart. All actions that are executed in the master chart are also automatically executed in this chart. A separate pause option is provided, through which XY-zoom and XY-panning modes are available. |

Time Bar | Specifies whether the time bar is displayed in the chart. |
Tool Bar | Specifies whether the toolbar is displayed in the chart. |
Color
Border Color | The color of the chart border. |
Forecolor | The color of the chart name. |
Gradient Background | A value between 0 and 1 can be used to display a color gradient in the background of the chart. |
Common
Comment | A free comment can be saved here. |
CPU Core | Here you can set (for each chart individually) which CPU core should be used for the current chart display. If required, multiple CPU cores can be specified for a chart. This may improve the performance. |
Name | Here you can set the name of the chart. |
Refresh Time [ms] | Defines the interval in which new values are to be displayed. |
Show Name | Specifies whether the name of the chart is shown in the graph. |
Settings
Bar Orientation | The bar orientation parameter can be used to set the orientation of the bars. |
Scale on Zoom | After zooming, the axes are rescaled to make it easier to read the values. |
Stacked Axes | This setting can be used to specify whether the axes of a chart are shown side by side or above each other. In the side by side display, the values of the appended channels are shown within the same area. If they are shown above each other, the channels are displayed in their own areas. |
To change the settings for several charts at the same time, please refer to the chapter Multiple selection.
The chart display is operated with the toolbar. The overview shows all buttons and their explanation (from left):

Play | Starts the live display mode. The data currently being accumulated are displayed. |
Break | The display switches to the pause mode. You can now navigate in the data already recorded without stopping the recording. |
Display-Width | This time refers to the display times of the minimum and maximum values in the array bar chart. The extreme values are always recorded. The freely adjustable display time makes it possible to display an extended history of the extreme values. |
Scroll buttons | The outer scroll buttons move the current display in steps that correspond to the display width. The inner scroll keys move the display only by a tenth of the display width and can be kept pressed to view the data set. |
Position | The displayed position can be edited in the Position field in the format hh:mm:ss,fff. The colons serve here as separators. If not all units are edited the format is sorted in ascending order, starting with seconds. |
Undo/Redo Time/Position | This option can be used to undo step changes in the display width or the current position, irrespective of how they were made (e.g. zoom, scroll, etc.). The right mouse button is likewise assigned this function. Once undone, values can be repeated with redo. |
Panning Horizontal | In the horizontal panning mode the current display can be shifted along the X-axis by clicking and dragging with the mouse.
|
Panning Free | In the free panning mode the current display can be shifted along the X- and Y-axes by clicking and dragging with the mouse. |
Zoom Horizontal | A new time range for the display can be selected by stretching a rectangle over the X-axis. |
Zoom Free | You can zoom into the current display by stretching a rectangle over the graphic area. |
Zoom to Default | If autoscale is set, this option triggers a zoom to the maximum number of array elements. If autoscale is disabled, the zoom automatically focuses on the defined limits. |
Zoom Out Max | Scales the X-axis such that all array elements are displayed. |
Chart Snipping Tool
| Screenshots of a chart can be edited and sent using the tool, see Chart Snipping Tool. |