Chart Snipping Tool
The Chart Snipping Tool contains various tools for marking a chart screenshot. The edited screenshot can be exported in various formats. Subsequently, it can be saved or sent directly via the tool by email.
 | You must make the settings for your chart such as zooming or panning before clicking the tool for copying to the clipboard for editing a screenshot. You cannot zoom with the tool. |
Opening the tool
- The recording of the scope view must be ended via the Stop Record button
 in the menu bar.
- 1. Click the icon at the end of the toolbar in the chart.

- The tool opens in a new window with the screenshot of the frozen view.
Application areas in the overview
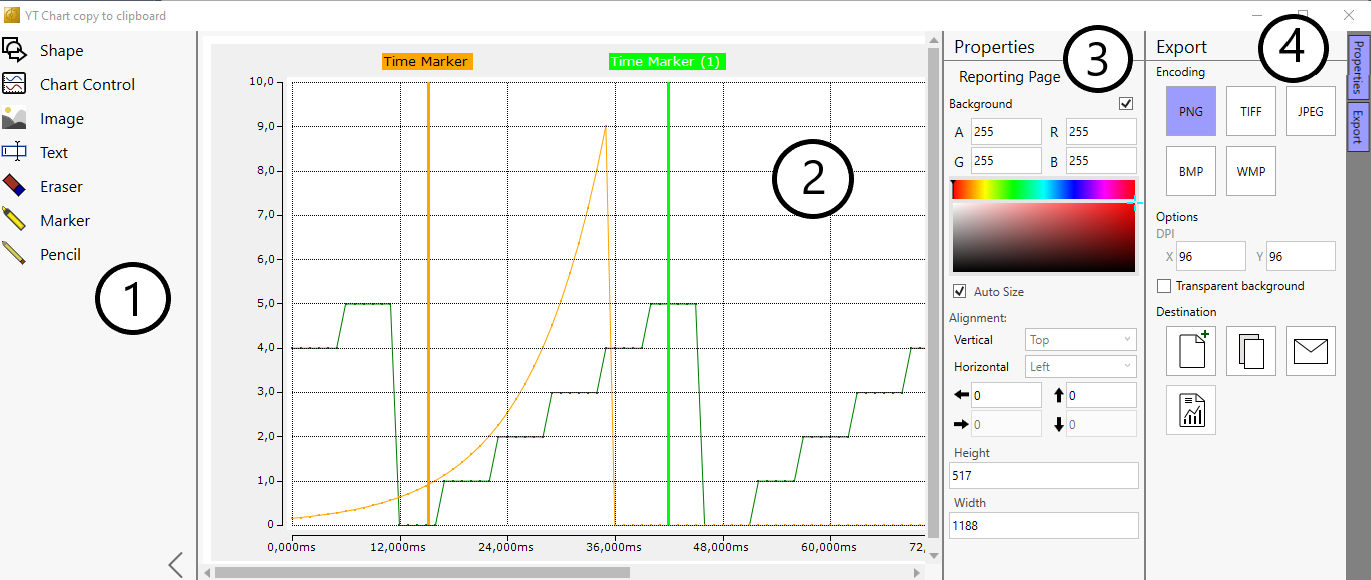
The Chart Snipping Tool consists of four areas
The Properties and Export columns must be opened by clicking the tabs at the top right edge of the screen.
- 1. Tool selection
- 2. Screenshot/editing area
- 3. Properties: options for the presentation type
- 4. Export: saving or sending the edited screenshot
- The size, shape, color, text, etc. of the selected tool are individually set with the Properties.
| You can delete every inserted shape afterwards if necessary. To do this, first click the Shape menu to activate the shape and then delete it via the Delete key. |
Tool
The following overviews explain the selection options and buttons and, if applicable, the procedure to use and design the tool.
In all input boxes in the Properties there is an up or down arrow at the end of the input line. If you click an arrow and hold the mouse button down, the value is continuously increased or decreased.
Selection -1- | Properties -3- | Description |
Shape | Double-click Shape. A circle is inserted in the editing area. The shape is subsequently designed in the Properties. | |
| Shape type | Via the drop-down menu you have various selection options for shapes that you can assign to the selection, such as rectangles and arrows. |
| Fill Color | If you activate the checkbox, the area is activated for coloring and you can define the fill color of the shape. |
| Border Color | If you activate the checkbox, the area is activated for coloring and you can define the border color of the shape. |
| Border Width | If you click the up or down arrow at the end of the input line, the width of the border changes. Alternatively, you can enter a value and press the Enter key. |
| Alignment | You can define the alignment and position of the shape via the input boxes in this area. Alternatively, you can change or move the active/marked shape directly via the crosshair or the boundary points. |
| Height/Width | You can define the alignment and position of the shape via the input boxes in this area. |
Chart Control | Double-click Chart Control. A square new view is inserted in the editing area. This other screenshot is subsequently designed in the Properties. You can also apply all tools to the newly created window.
| |
| Graphic Library | You can assign a graphic library, GDI_Plus or DirectX, via the drop-down menu. |
| Scope View Data | Via the drop-down menu, select a chart that you wish to highlight/edit via the new cut-out. |
| Alignment, Height, Width | Settings for the alignment, height and width. |
Image | Double-click Image. A square new view is inserted in the editing area. The view is subsequently designed in the Properties. | |
| Image | Via the drop-down menu, select an image with a timestamp that you wish to insert in the new cut-out. Via the file symbol you can select and insert any image you like. |
| Alignment, Height, Width | Settings for the alignment, height and width. |
Text | Double-click Text. A text box is inserted in the editing area. You can enter the text directly in the text box or in the text box in the Properties. Both input options are identical. | |
| Use Text Wrapping | If you activate the checkbox, the text in the text box is automatically wrapped according to the specified shape. |
| Font Size, Color and Style | Settings for the font size, color and style. |
| Alignment, Height, Width, | Settings for the alignment, height and width. |
Eraser | With the eraser tool you can remove previously added drawing lines again. | |
| Width, Height, Shape | Settings for the height, width and shape of the eraser tool. |
Marker | With the marker you can apply highlights freehand. | |
| Width, Height, Color, Shape | Settings for the height, width, color and shape of the marker. |
Pencil | With the pencil you can do freehand drawings. | |
| Width, Height, Color, Shape | Settings for the height, width, color and shape of the pencil. |
 Legend: you can insert a legend via the icon in the top right screen of the window.
Export -4-
Selection | Description | |
Encoding | Via the tiles in the Encoding area you can select a file format for the screenshot you have made, such as PNG, TIFF, JPEG, BMP or WMP. The selected tile is given a purple background. | |
Options |
| |
| DPI | In this area you can specify the resolution for the X and Y-axes. |
| Transparent background | If you activate the checkbox, the chart background is removed and you can insert it without a background into another file or graphic. |
Destination |
| |
|
| Save file as: The "Save as" dialog is opened by clicking the icon. |
|
| Copy: The edited screenshot is placed on the clipboard by clicking the icon. You can insert it directly in any position you like with the shortcut Ctrl + V. |
|
| Mail: The edited screenshot is automatically attached to a new email by clicking the icon. |
|
| Reporting: Clicking on the icon opens the Scope Manual Reporting Wizard. The edited screenshot is added to a Data Message sent to the Reporting Server. |
Messages | Messages or error messages for saving/sending are shown in the lower area. | |


