XY chart properties
All settings assigned to the XY chart can be made here.
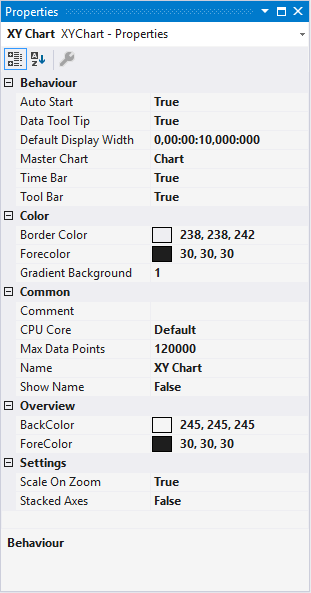
Behaviour
Auto Start | If this option is enabled, the chart starts the live display when a new recording is started. |
Data Tool Tip | If this option is enabled, a click on a data point results in display of a tool tip with the exact values of the data point on the X- and Y-axis, plus the timestamp and name of the corresponding channel. |
Default Display Width | This time indicates the display time for the signal or the signal length in the XY chart. This value is set, for example, when the rescale button is selected in the chart toolbar. |
Master Chart | In the drop-down list that is available here, a chart that is part of the current configuration can be selected and designated as master chart. All actions that are executed in the master chart are also automatically executed in this chart. A separate pause option is provided, through which XY-zoom and XY-panning modes are available. |

Time Bar | Specifies whether the time bar is displayed in the chart. |
Tool Bar | Specifies whether the toolbar is displayed in the chart. |
Color
The background and frame color can be set by means of color dialogs.
Common
Comment | A free comment can be saved here. |
CPU Core | Here you can set (for each chart individually) which CPU core should be used for the current chart display. If required, multiple CPU cores can be specified for a chart. This may improve the performance. |
Max Data Points | Determines the maximum number of data points that can be displayed at the same time. The default value is 120,000. This means that, at a sampling rate of 1 ms (TaskSampleTime), the maximum recording time for which values can be displayed simultaneously is 2 minutes. |
Show Name | Specifies whether the name of the chart is shown in the graph. |
Settings
Scale on Zoom | If this option is selected, the chart instructs all axes (X and Y) to perform autoscaling after a zoom or panning action. This can be used to expand the selected area. |
Stacked Axes | This setting can be used to specify whether the axes of a chart are shown side by side or above each other. In the side by side display, the values of the appended channels are shown within the same area. If they are shown above each other, the channels are displayed in their own areas. |
To change the settings for several charts at the same time, please refer to the chapter Multiple selection.
The chart display is operated with the toolbar. The overview shows all buttons and their explanation (from left):

Play | Starts the live display mode. The data currently being accumulated are displayed. |
Break | The display switches to the pause mode. You can now navigate in the data already recorded without stopping the recording. |
Display-Width | The current display width is displayed here. It can be edited in the format hh:mm:ss,fff. Alternatively, the display width can be changed by turning the mouse wheel in the selected chart window. The changed value is adopted automatically. |
Scroll buttons | The outer scroll buttons move the current display in steps that correspond to the display width. The inner scroll keys move the display only by a tenth of the display width and can be kept pressed to view the data set. |
Position | Shows the position. It can be edited in the format hh:mm:ss,fff. The colons are used as separators. If not all units are edited the format is sorted in ascending order, starting with seconds. |
Panning Free | In the free panning mode the current display can be shifted along the X- and Y-axes by clicking and dragging with the mouse. |
Zoom Free | You can zoom into the current display by stretching a rectangle over the graphic area. |
Zoom to Default | Carries out an autoscale on all axes. The X-axis is/axes are set to the default display time. |
Zoom Out Max | Scales the X and Y-axis in such a way that all current values in the recording appear in the display. Up to the maximum number of data points that can be shown. The maximum number is 60,000 data points. |
Chart Snipping Tool | Screenshots of a chart can be edited and sent using the tool, see Chart Snipping Tool. |
By turning the mouse wheel you can also zoom in or out on the current display. The cursor position defines the center.
The current recording times are displayed in the chart toolbar:
Start-Time | The common starting point of the recordings of all connected channels. The start time defines thus the zero point of the recording. |
End-Time | Maximum common time of all connected channels. The end time marks the end value of the recording. The difference between the end time and start time is maximally as large as the record time set (see also: Scope nodes). |
Position | The position time represents the zero point of the current chart, i.e. the time from the start time to the beginning of the display. |
Time | Absolute time at the chart origin. |
Date | Absolute date at the chart origin. |