Bode Plot - Architecture
Not only are signal curves represented in the TwinCAT Bode Plot; recording configurations are also created. For the creation of these configurations, it is important to be familiar with the architecture of the Bode Plot. The architecture is reflected in the tree structure within the Measurement project in the Solution Explorer.
The architecture of a Bode project
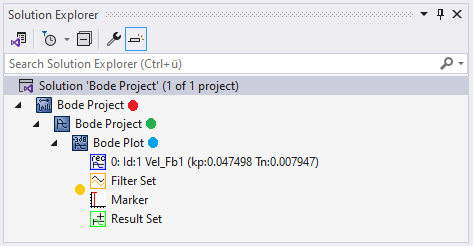
(Measurement) Bode Project: |
Bode project: |
Bode Plot: The display area for a plot contains one chart each for the amplitude and phase responses, in which the already recorded or generated characteristic curves (sets) for the associated axis are displayed. While a recording is in progress, a third chart showing the current actual and setpoint values may be displayed. Apart from the connection data for the drive axis, the parameters for the next recording are also set via the Bode Plot. If you click on a Bode project, the setting options are displayed in the Properties window. See also: Bode Plot properties |
Set: There are three types of sets:
Among other things, the appearance, e.g. color and line width, can be adjusted in the Properties window. See also: Set Properties |


Window
The interfaces for the control of the Bode Plot are divided into several windows (Tool windows) and their position and size are freely configurable.
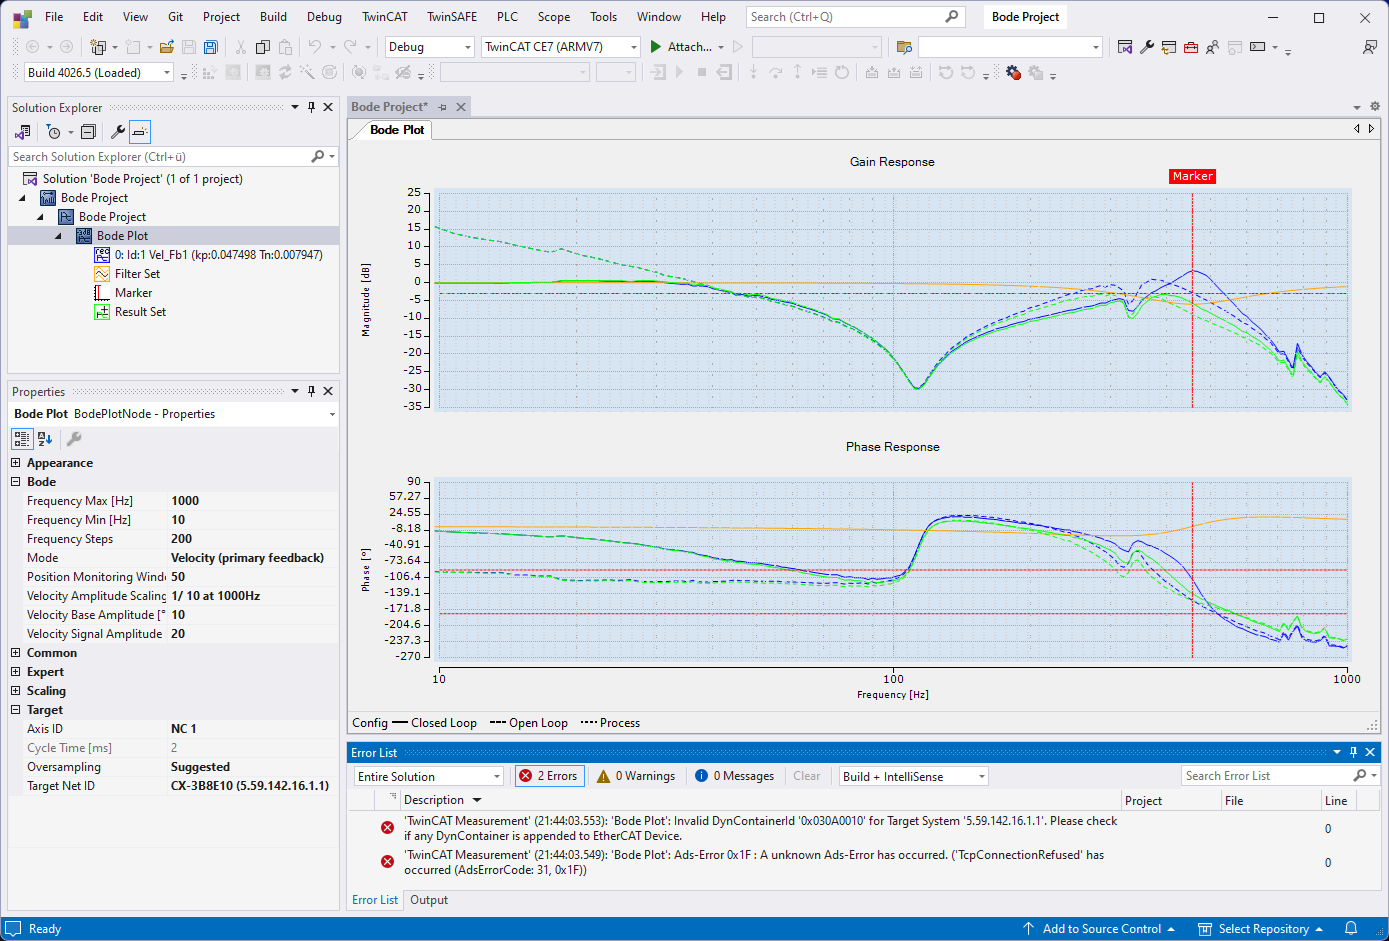
Overview of the individual windows:
Solution Explorer | Representation of the project structure within a solution. |
Error list | List of errors, warnings and messages. Each scope project lists the generated messages independently here. The messages for the respectively selected Scope can be deleted via the context menu item "Clear Error List". |
Properties | The settings of the respective element that is selected in the Solution Explorer can be modified here. |
Bode Plot editor | Representation of the individual plots of a Bode project. The plots can be displayed next to each other or in overlapping tabs within the project window, exactly like all other windows. |
Configuration
The options for creating or editing a Bode configuration are explained below. The way in which the properties of the respective elements can be changed is described in the description of the associated window.
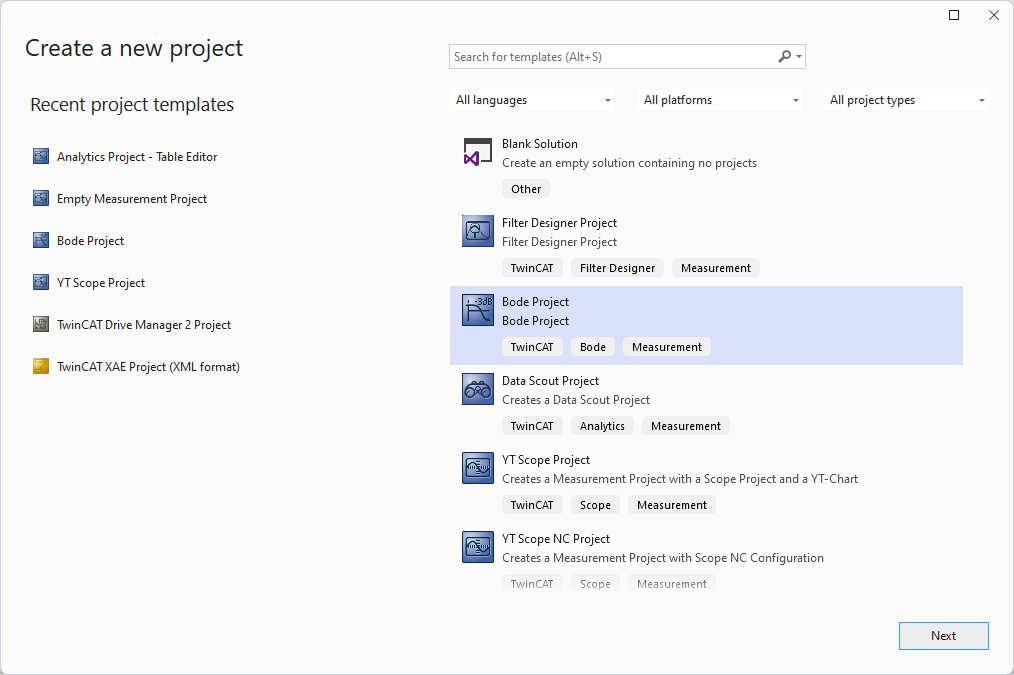
Creation of a Measurement project
File > New > Project… > Selection of the desired template.
Addition of a Bode project to a Measurement project
Context menu for the Measurement project > Add > New Item... > Selection of the desired template.
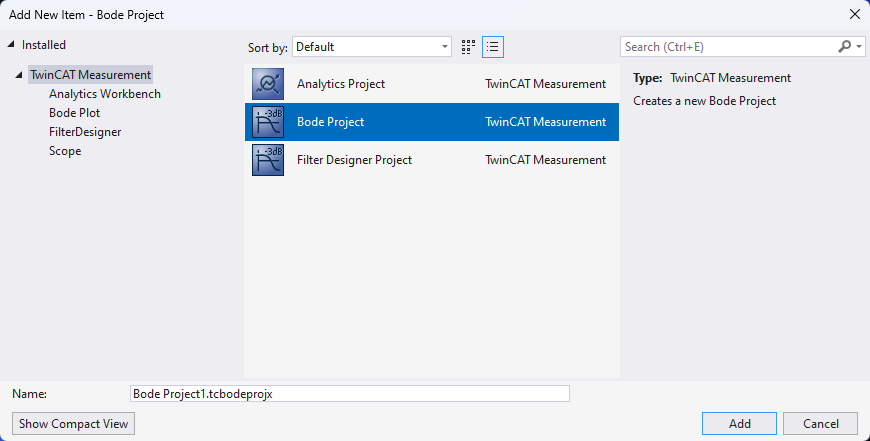
List of the available templates:
Bode project | Standard Bode project with a Bode Plot |
Context menu for the Measurement project > Add > Existing Item... > Selection of the desired file (.bodeprojx)
Drag and drop the desired file (.bodeprojx) onto the Measurement project in the Solution Explorer.
Addition of individual elements:
New Plot | Context menu of the Bode project instance → New Plot |
New Filter Set | Context menu of the plot instance → New Filter Set |
New Result Set | Context menu of the plot instance → New Result Set |
New Marker | Context menu of the plot instance → New Marker |
Deletion of elements
- Select the element in the Solution Explorer > [Del] key.
- Context menu of the element > Delete
Saving a Bode configuration
File > Save (Default keyboard shortcut: [Ctrl] + [S])
A file (.bodeprojx) is saved in the project directory.