Switching multiple machines in the HMI Dashboard
In TwinCAT Analytics you can use different data streams from several machines, which you can switch in an analysis. This is possible both in the Analytics Workbench via the Virtual Input Source and in the fully generated PLC and HMI. Both live and historical data can be used. For each data stream, you can add a brief description and the location either in the Analytics Logger or in the Machine Administration.
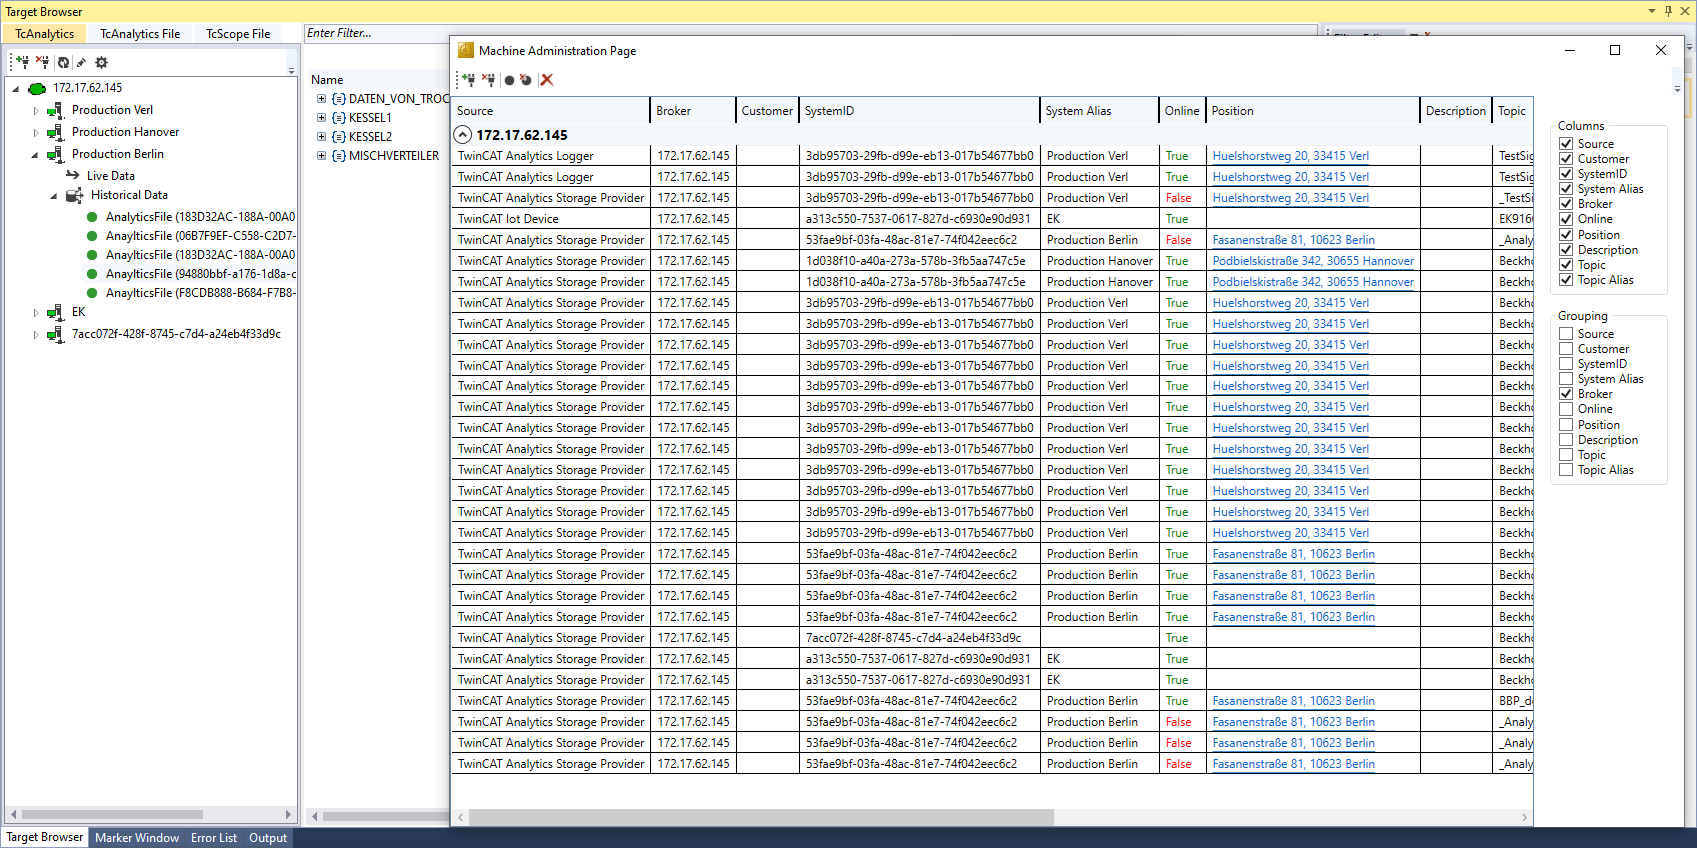
Machine Administration page
If not already done in the Overview, set the metadata of your machine on the Analyse data page. Open the TwinCAT Target Browser (TwinCAT > Target Browser > Target Browser) and click the gear icon. Now you can enter the location of your machine, a short description and the name of your machine. Note that existing data in an Analytics project is not assigned this meta information, since the information is only transferred from the Target Browser during drag and drop. In this case, you can delete the data stream and recreate it.
For each data stream you use in your Analytics configuration, the Runtime deployment creates a map entry. These map entries are used as input variables for the general map on the start page of your HMI dashboard.
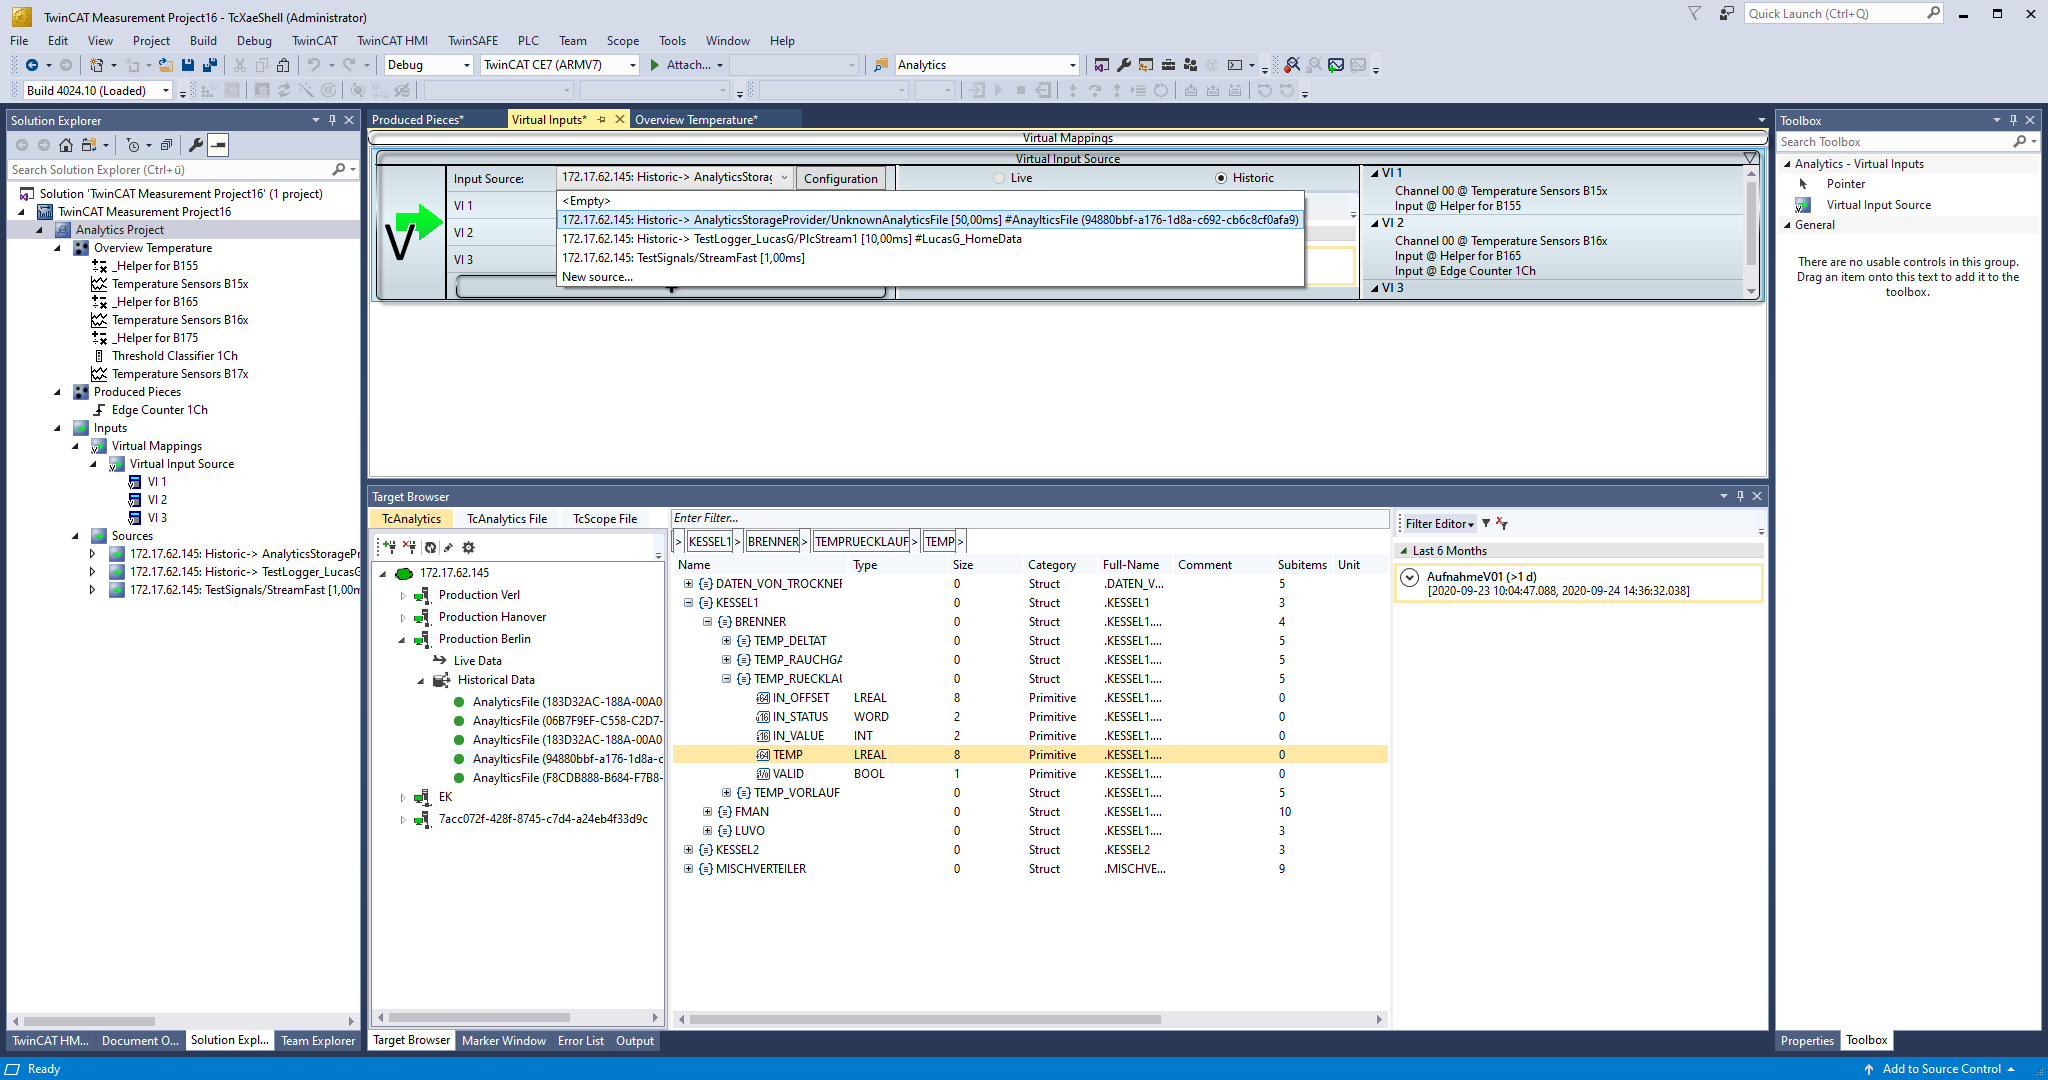
In the Analyse data the data streams are listed under Sources. These are created by using data from various sources from the TwinCAT Target Browser. These sources are listed in the Virtual Input Source. It is possible to switch between the sources. Check that all individual inputs are linked and that none is set to Empty by clicking each source once (which corresponds to a switch in the workbench). You can then generate an HMI with PLC.
Deploy Wizard
In Runtime deployment, any number of configurations can be created at Input Source, which can be switched in the HMI. This makes it possible in the analysis HMI to analyze and switch live as well as historical data from possibly different machines. Each of the listed configurations can be analyzed in parallel. A configuration always has as many Virtual Input Sources as are configured in the Analytics Workbench.
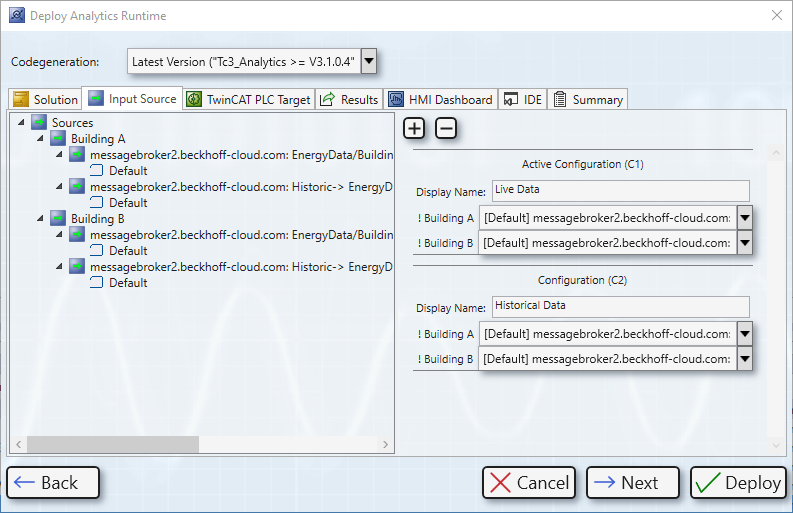
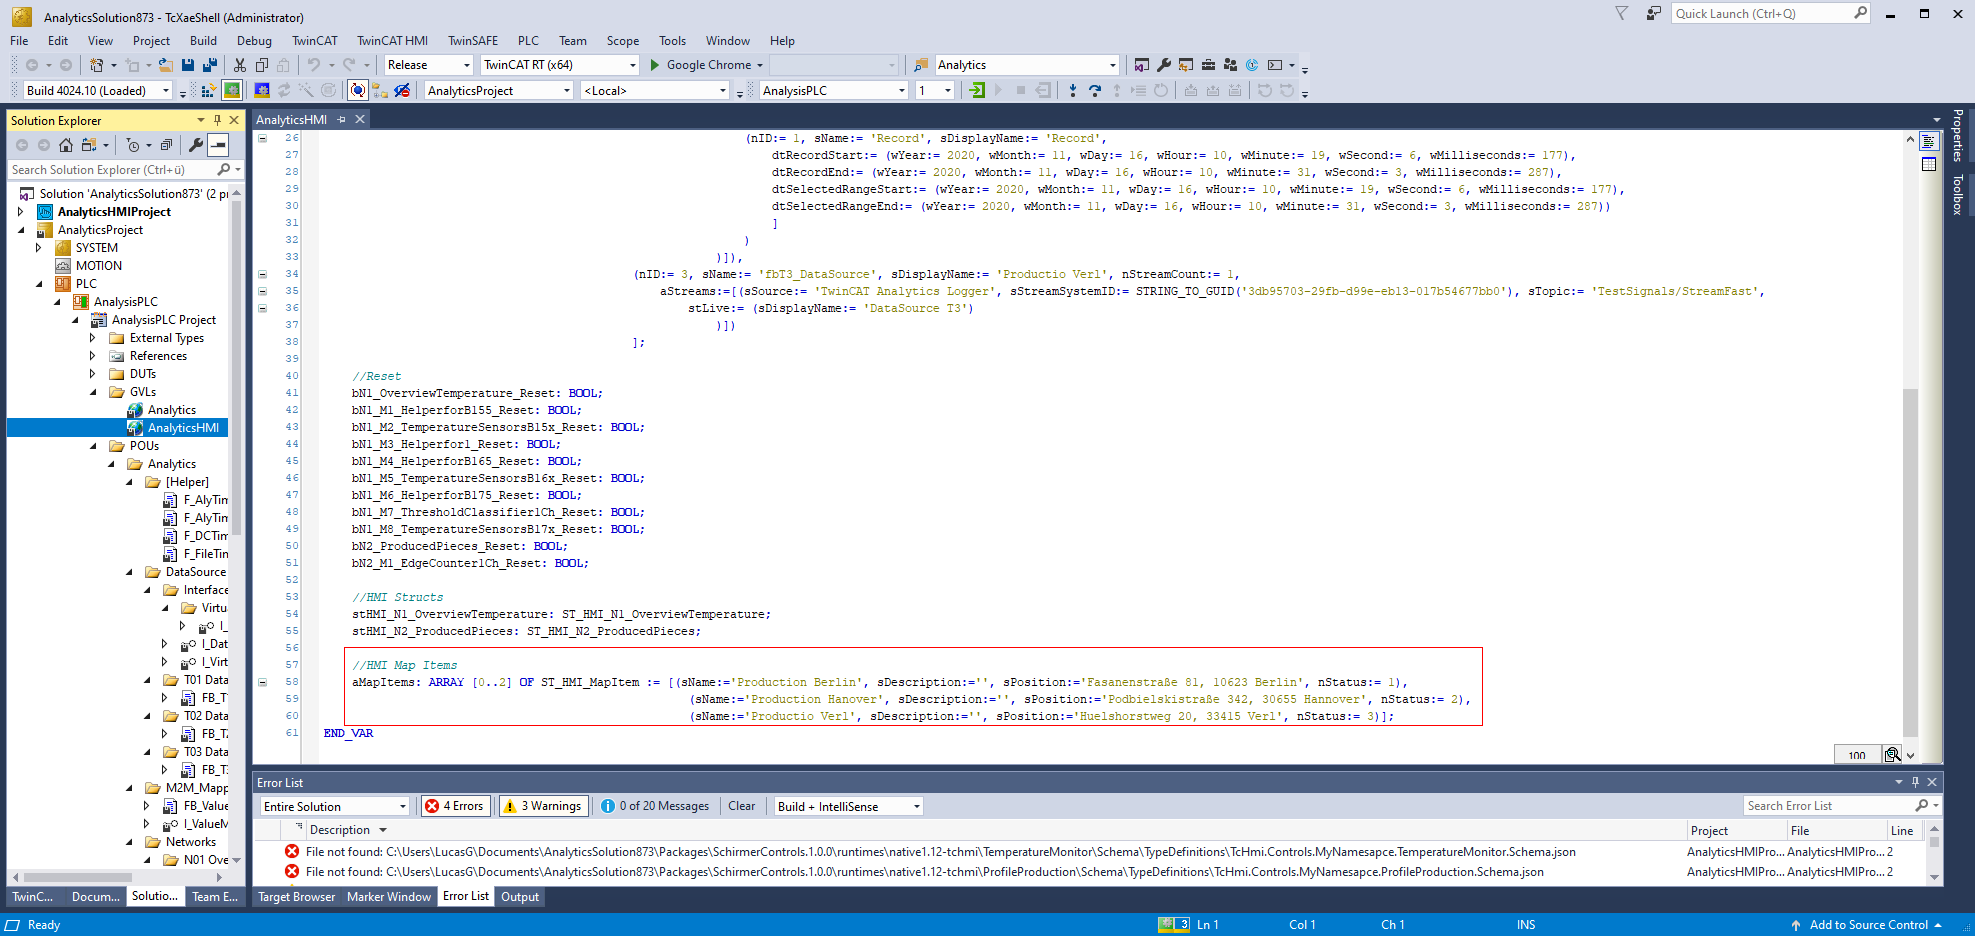
After a successful HMI and PLC generation, the names, positions, and descriptions of the input sources are entered into the global variable list of the PLC. If something is not right or you want to change a value afterwards, you can do this directly in the PLC.
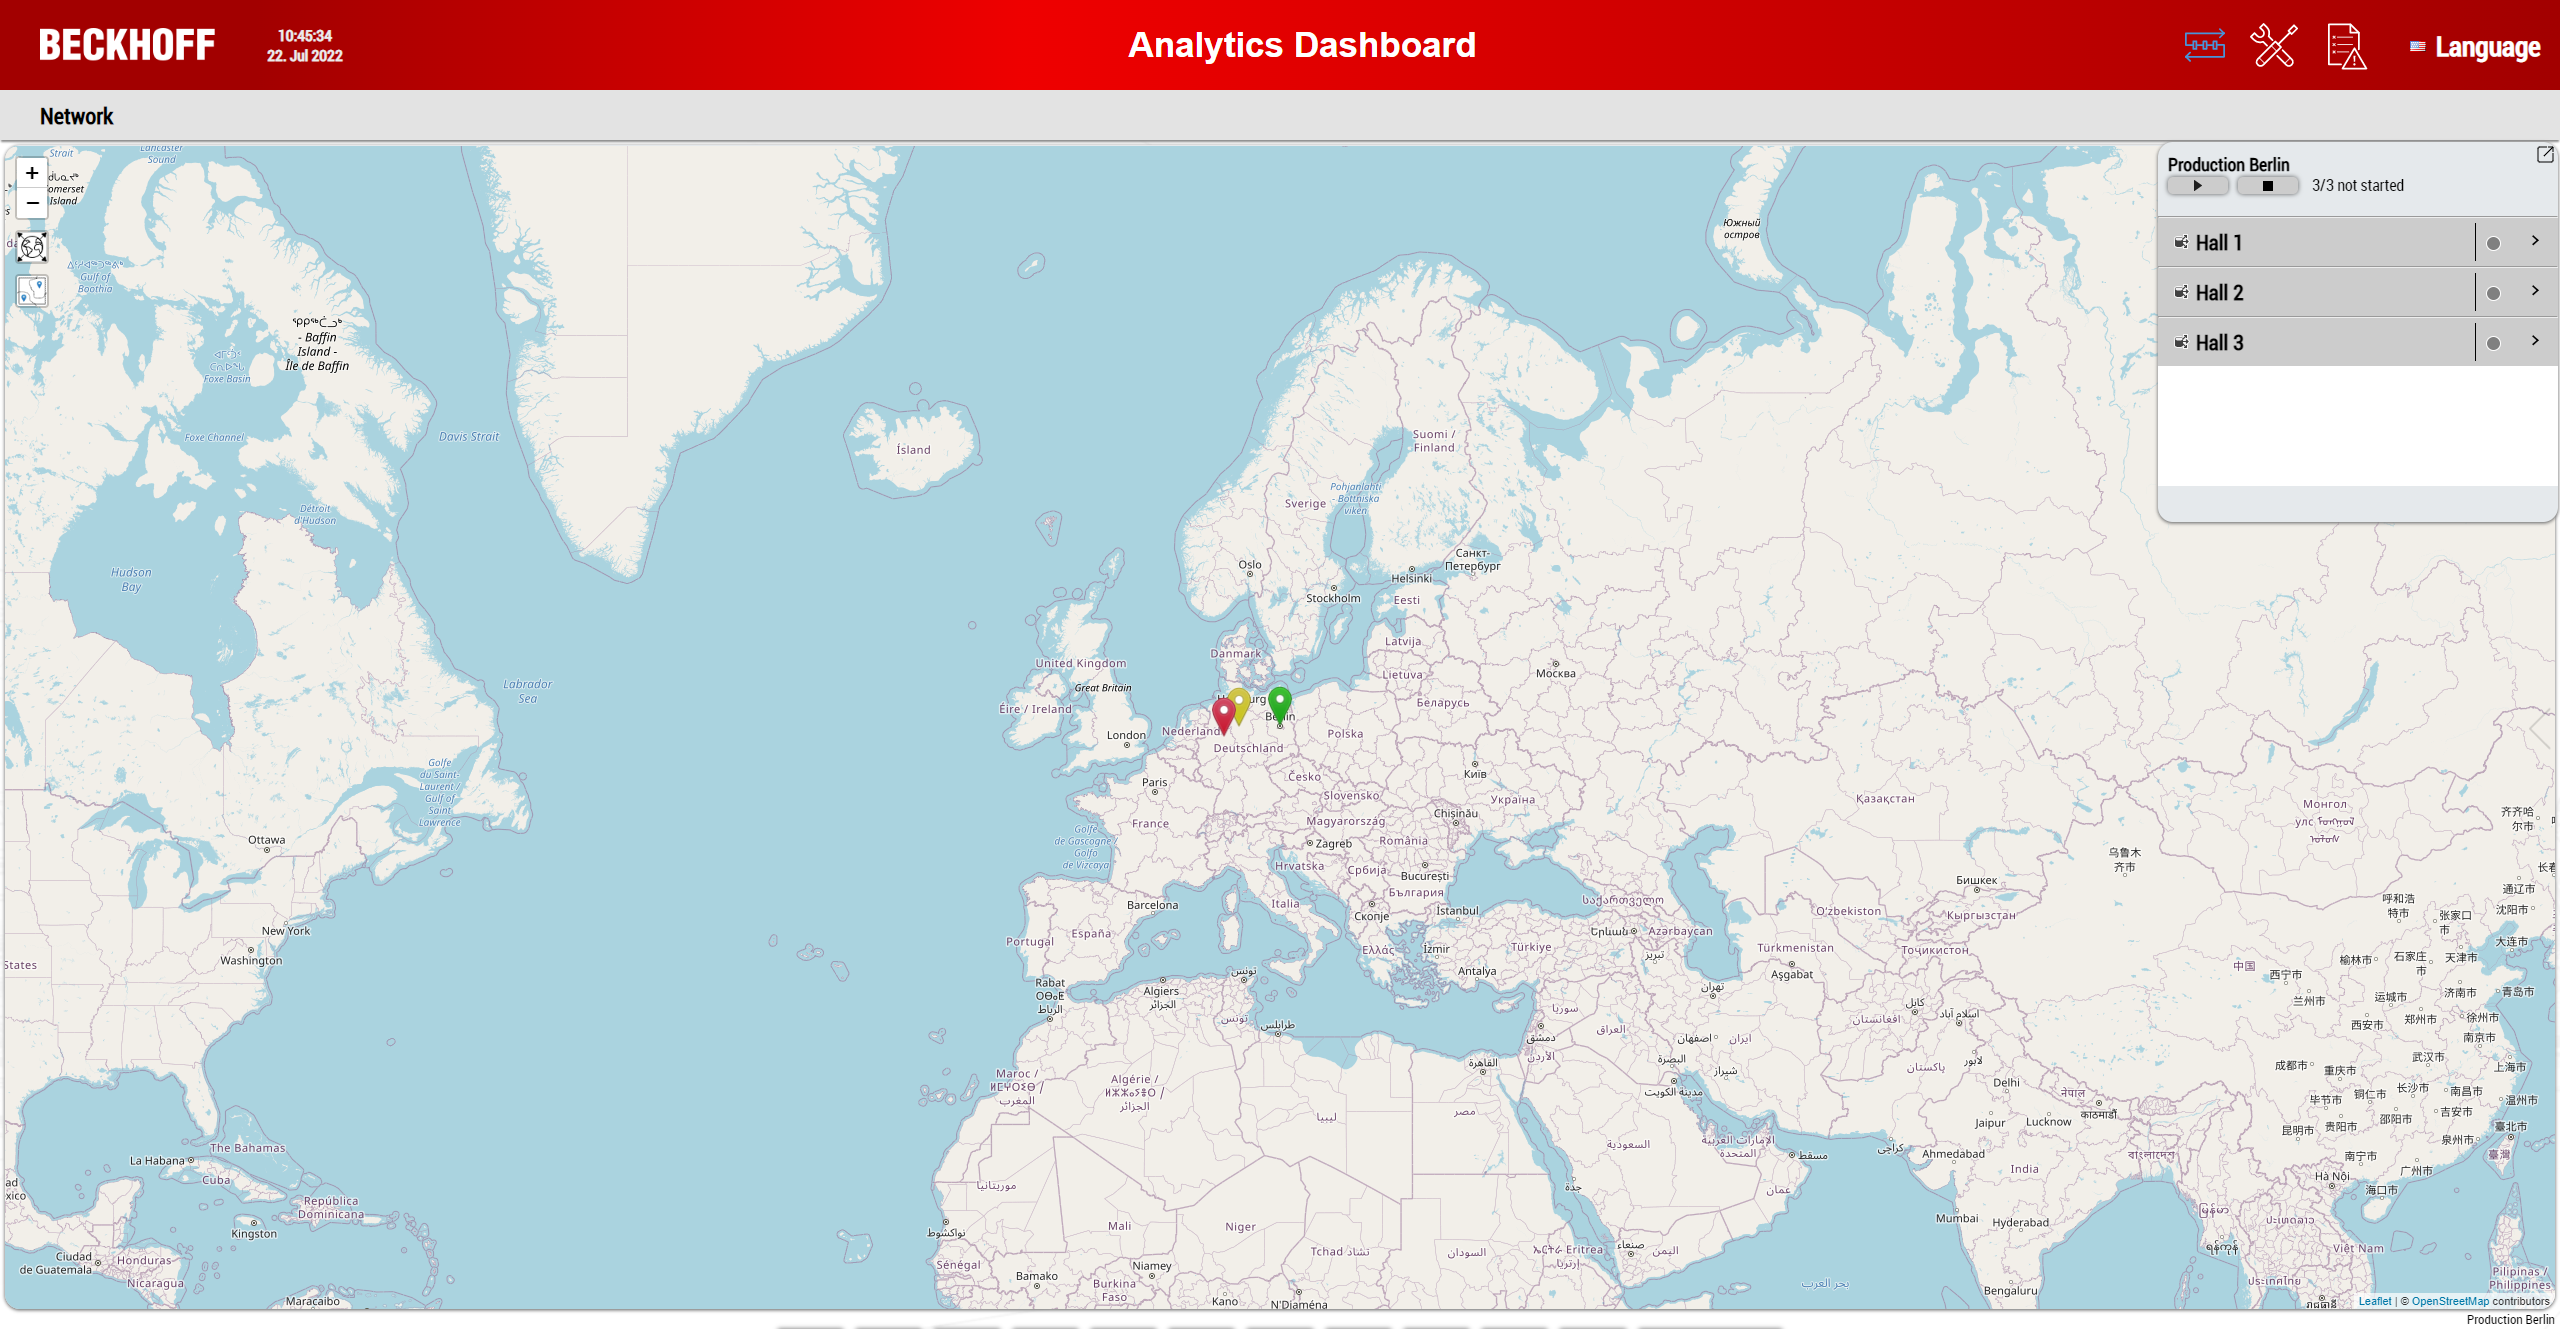
Map with machines
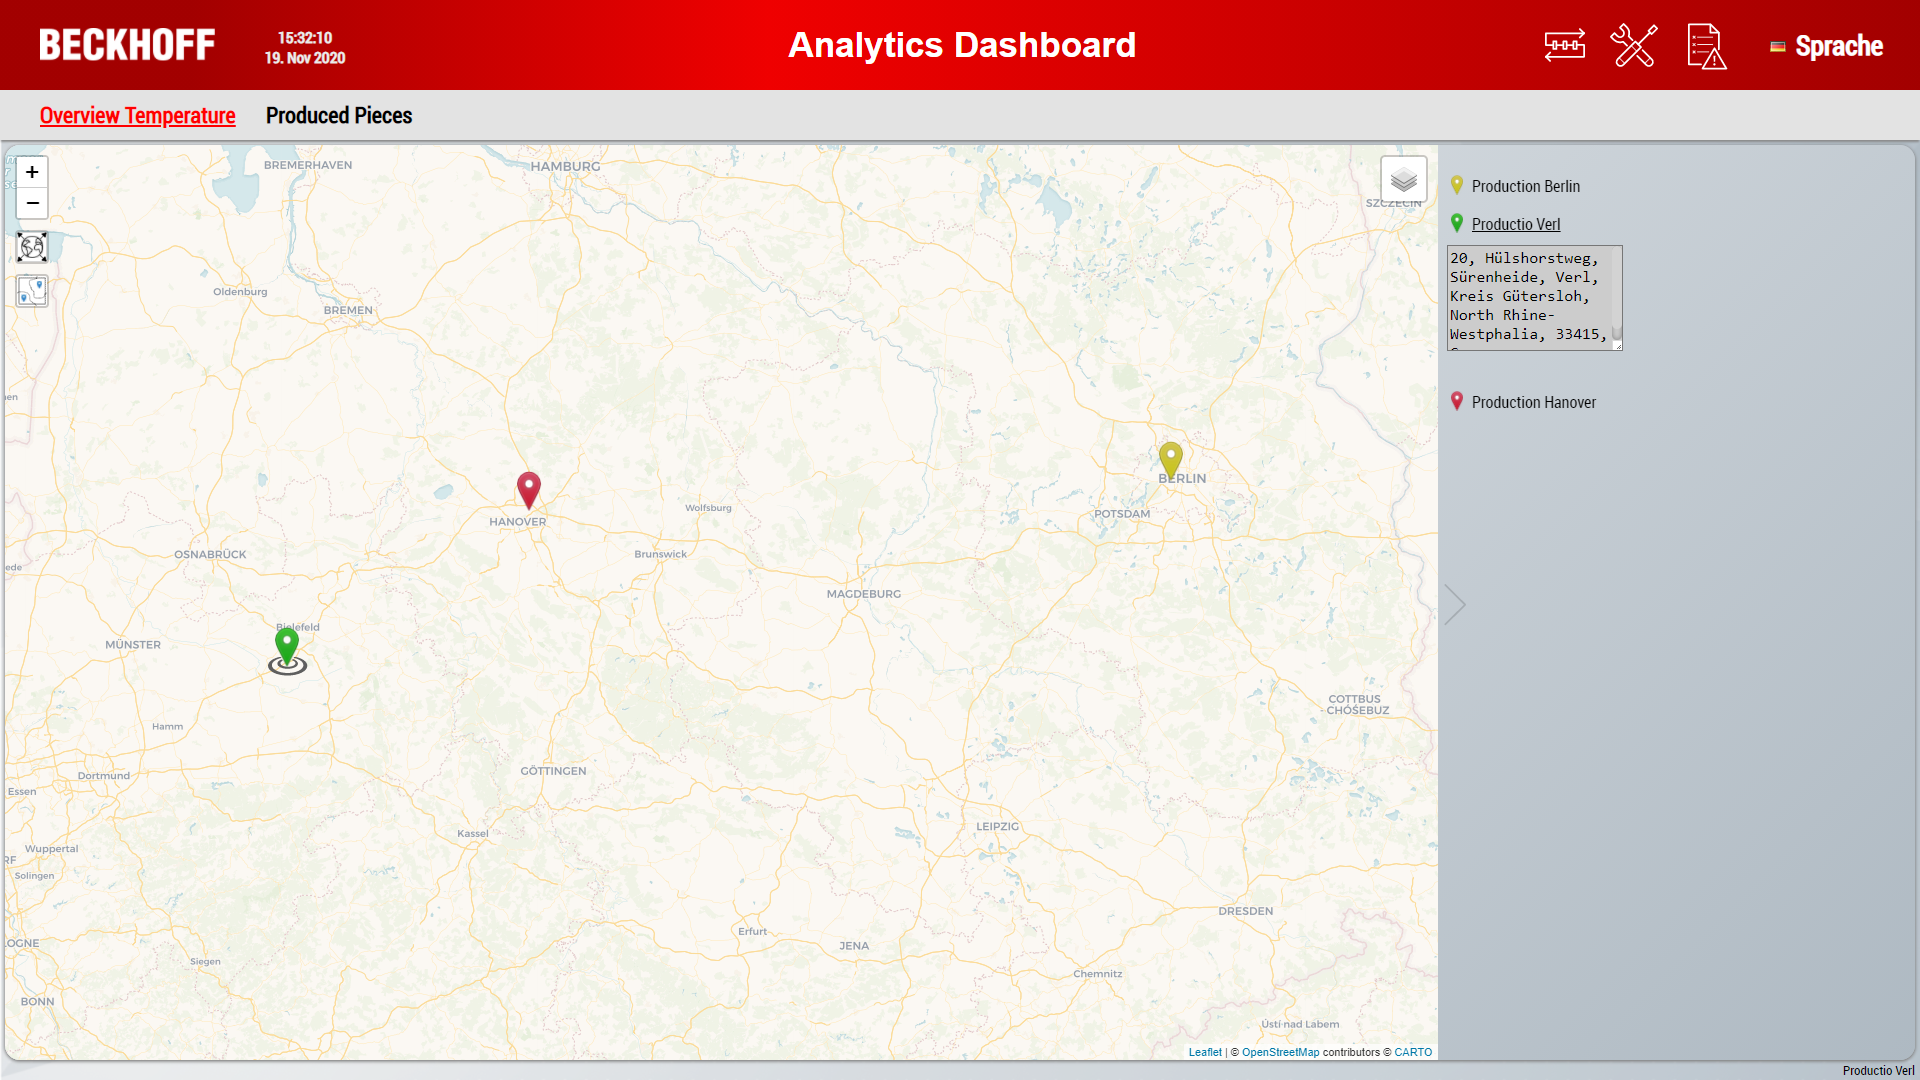
If you selected to create a start page, the Map Control will be created on the homepage of your HMI Dashboard. The map shows all machine locations and lists the names of the machines (system alias) in the legend. The legend can be opened and closed using the arrow on the right. The icon color indicates the current machine status: green = OK, yellow = Warning, red = Alarm.
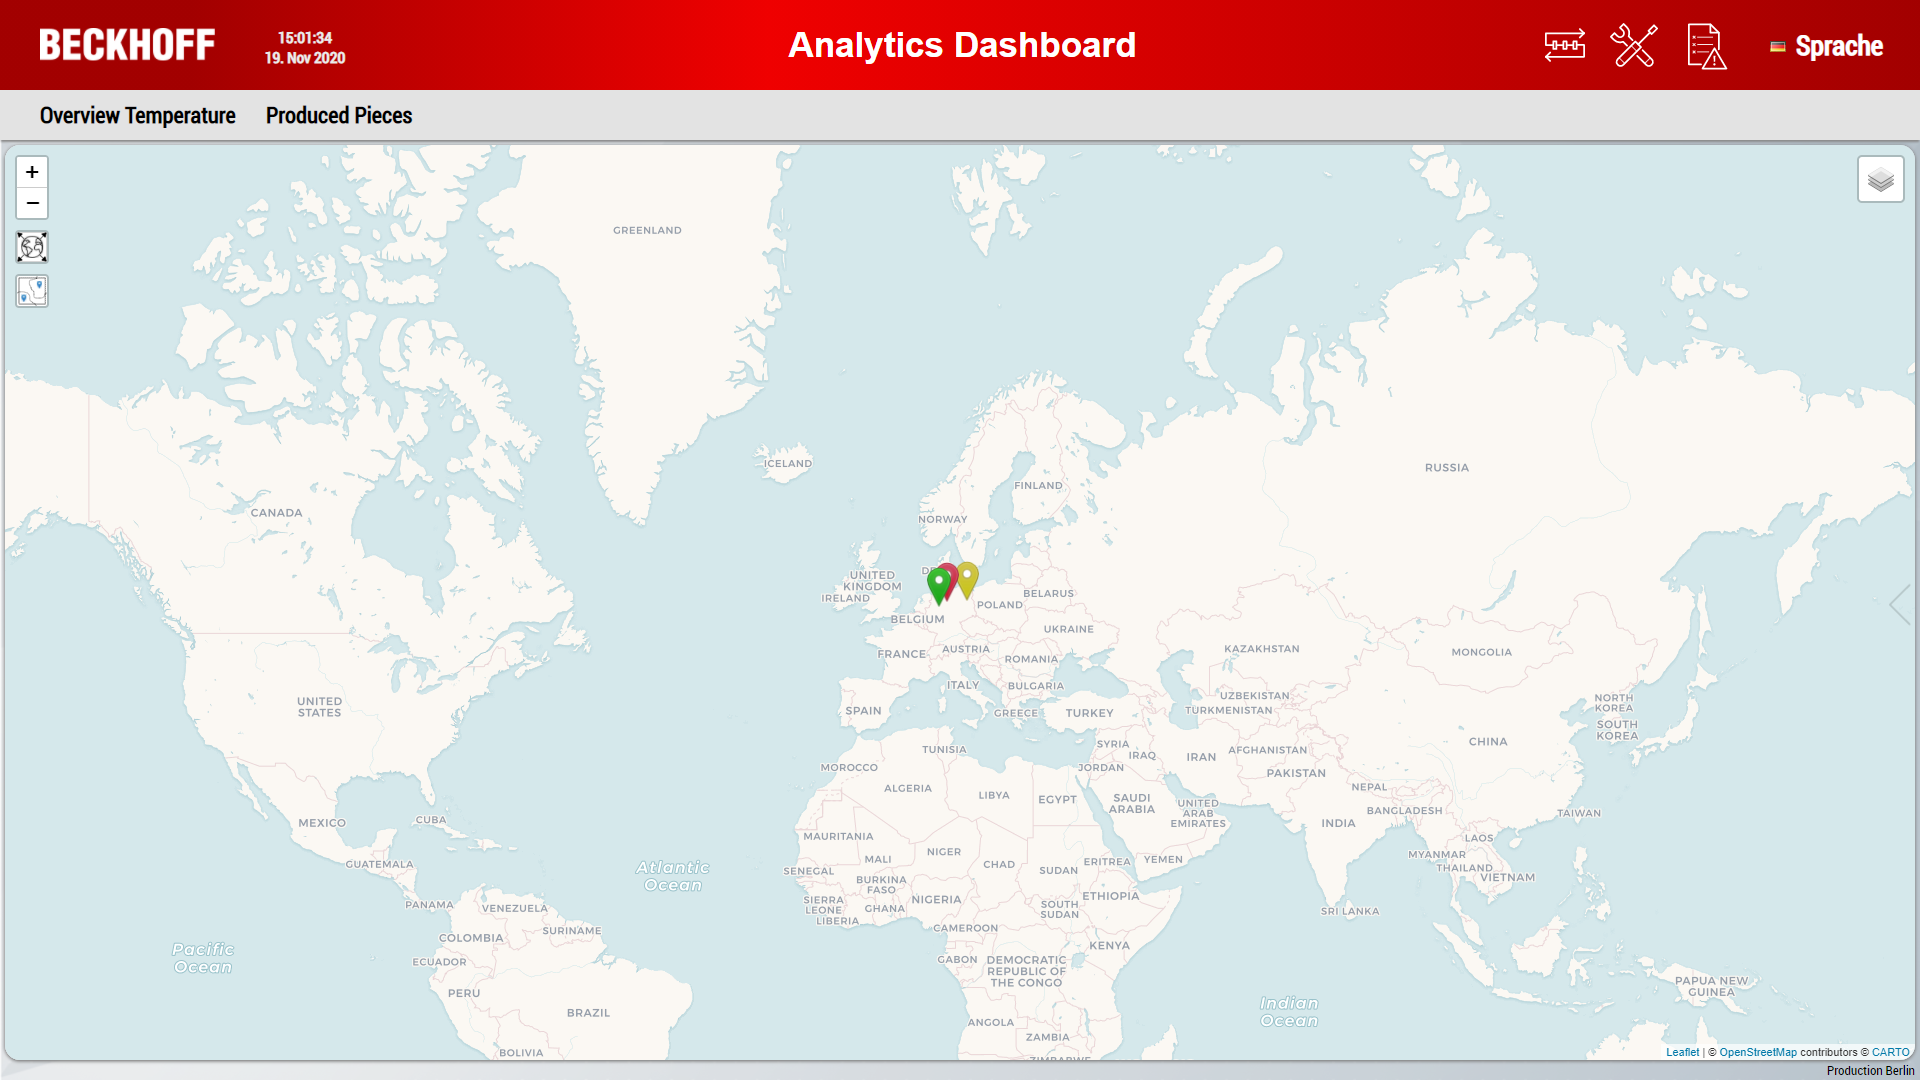
You can zoom in on a single icon by double-clicking it and zoom out to an overview of all machines using the icons on the left. It is also possible to click on an icon on the map. The corresponding legend entry is automatically highlighted. This also works the other way around, i.e. when you click on a legend entry, the corresponding icon is automatically highlighted.
Switching machine data
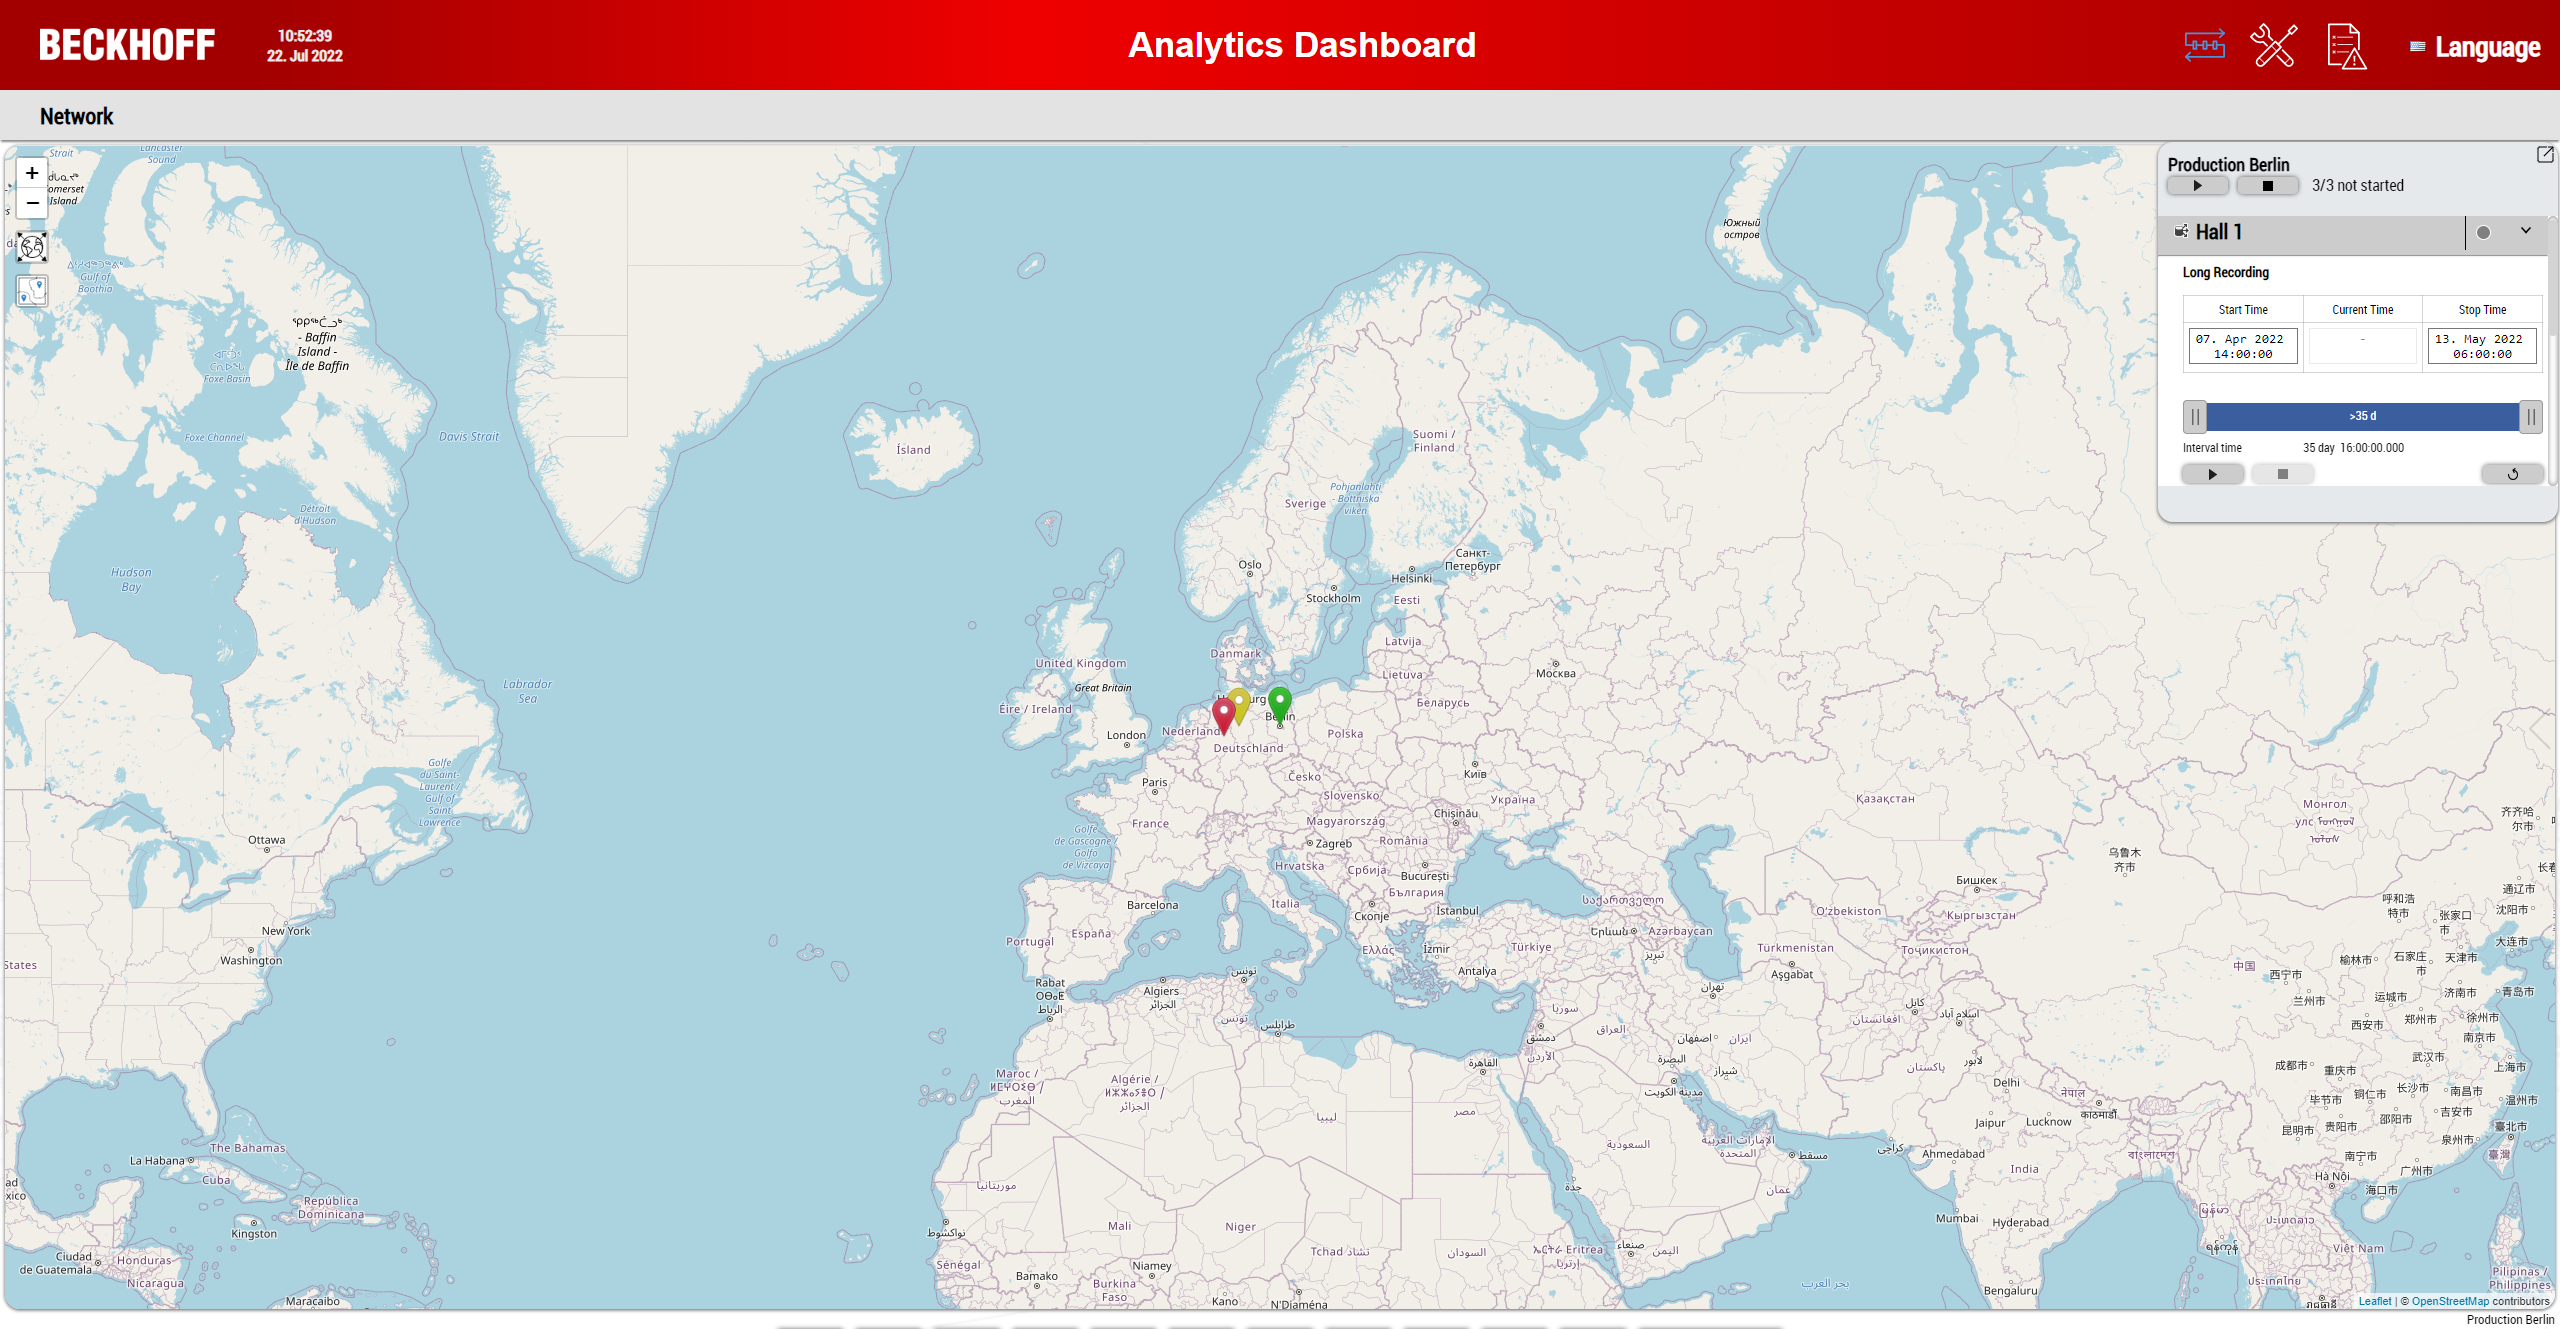
In addition to the map with the individual machine configurations, the analyses for the individual configurations can be switched. In the PLC all analyses run in separate tasks, which means that all analysis data is available at the same time. In the generated HMI, the various machines can be switched over in a specially developed control. The control can be opened and closed via the icon highlighted in the image below (black arrow).
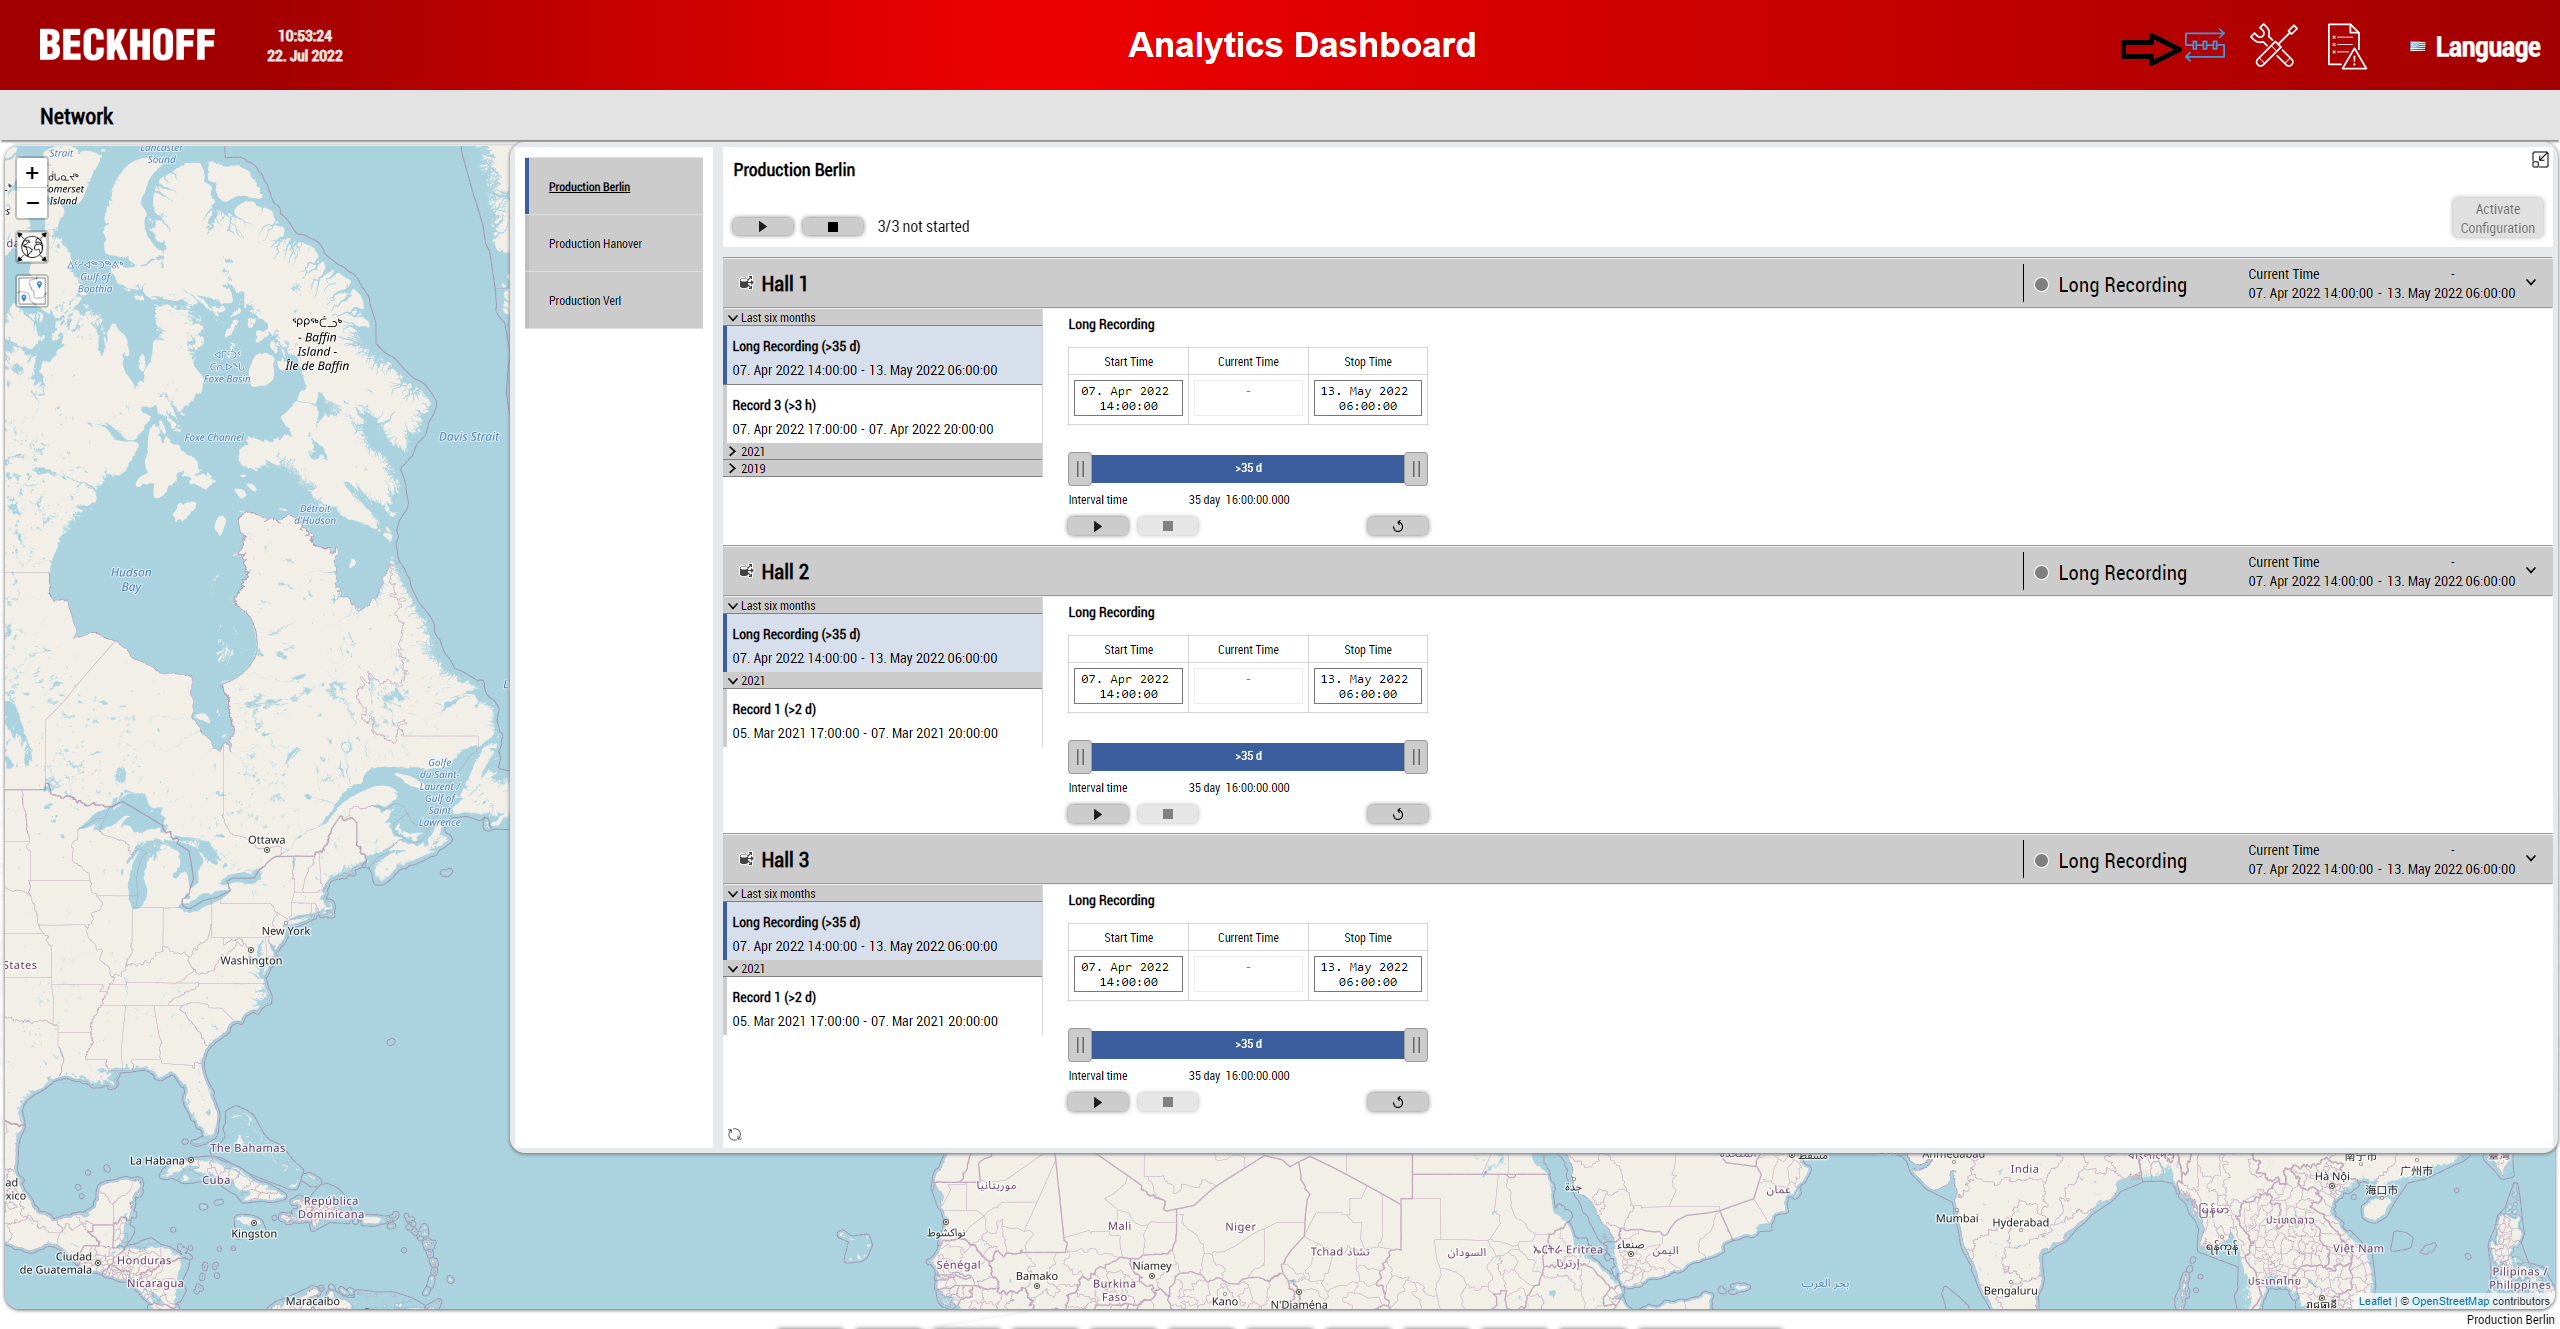
The configurations that were previously shown on the map with the locations can be selected in the control. A configuration can consist of live and historical data, whereby only historical data is configured for the Production Berlin. Historical data can be analyzed equivalently as in Working with Historical Data in the HMI.
When clicking on another machine, this configuration is only displayed in the control. To activate, click Activate Configuration.
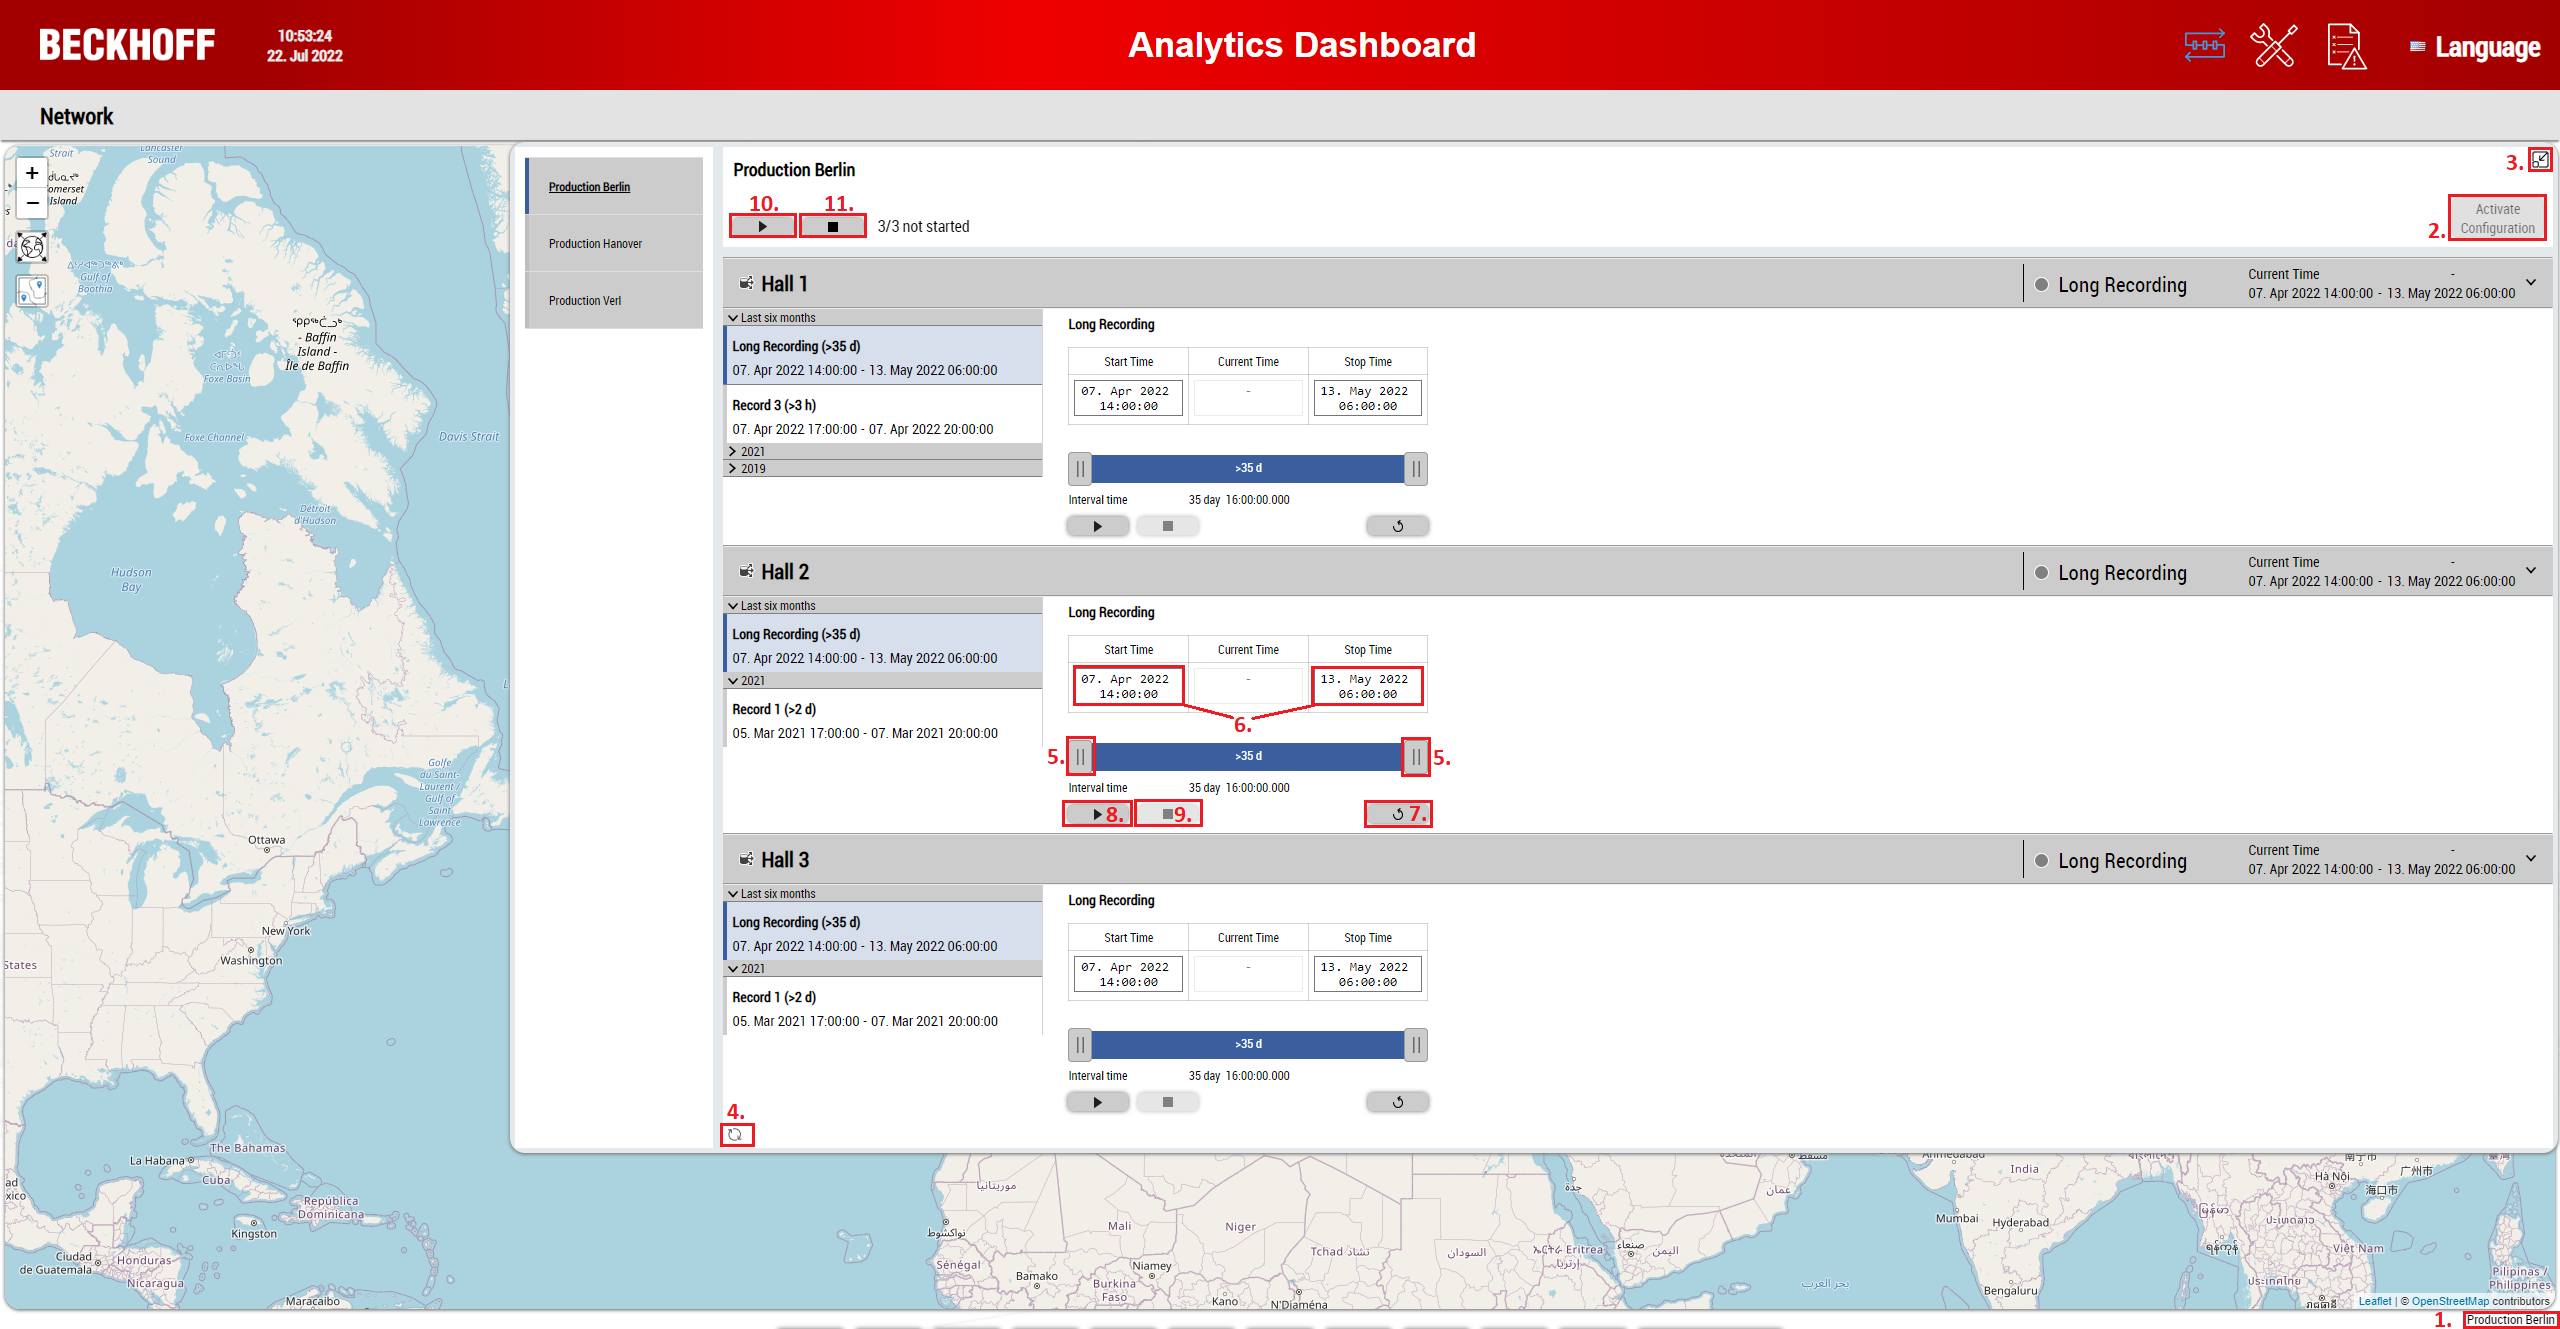
The control is explained below.
- The currently active configuration.
- Button to activate the selected configuration.
- Selection window to minimize (and automatically activate the selected configuration).
- Reloading the record list. This allows data recorded subsequently to be dynamically loaded and analyzed in the dashboard.
- Selection of the start and end times via a slider.
- Selection of the start and end date via a selection window with calendar.
- Resetting the start and end times.
- Starting the analysis of the selected Input Source.
- Cancel the analysis of the selected Input Source.
- Starting the entire analysis
- Cancel the entire analysis
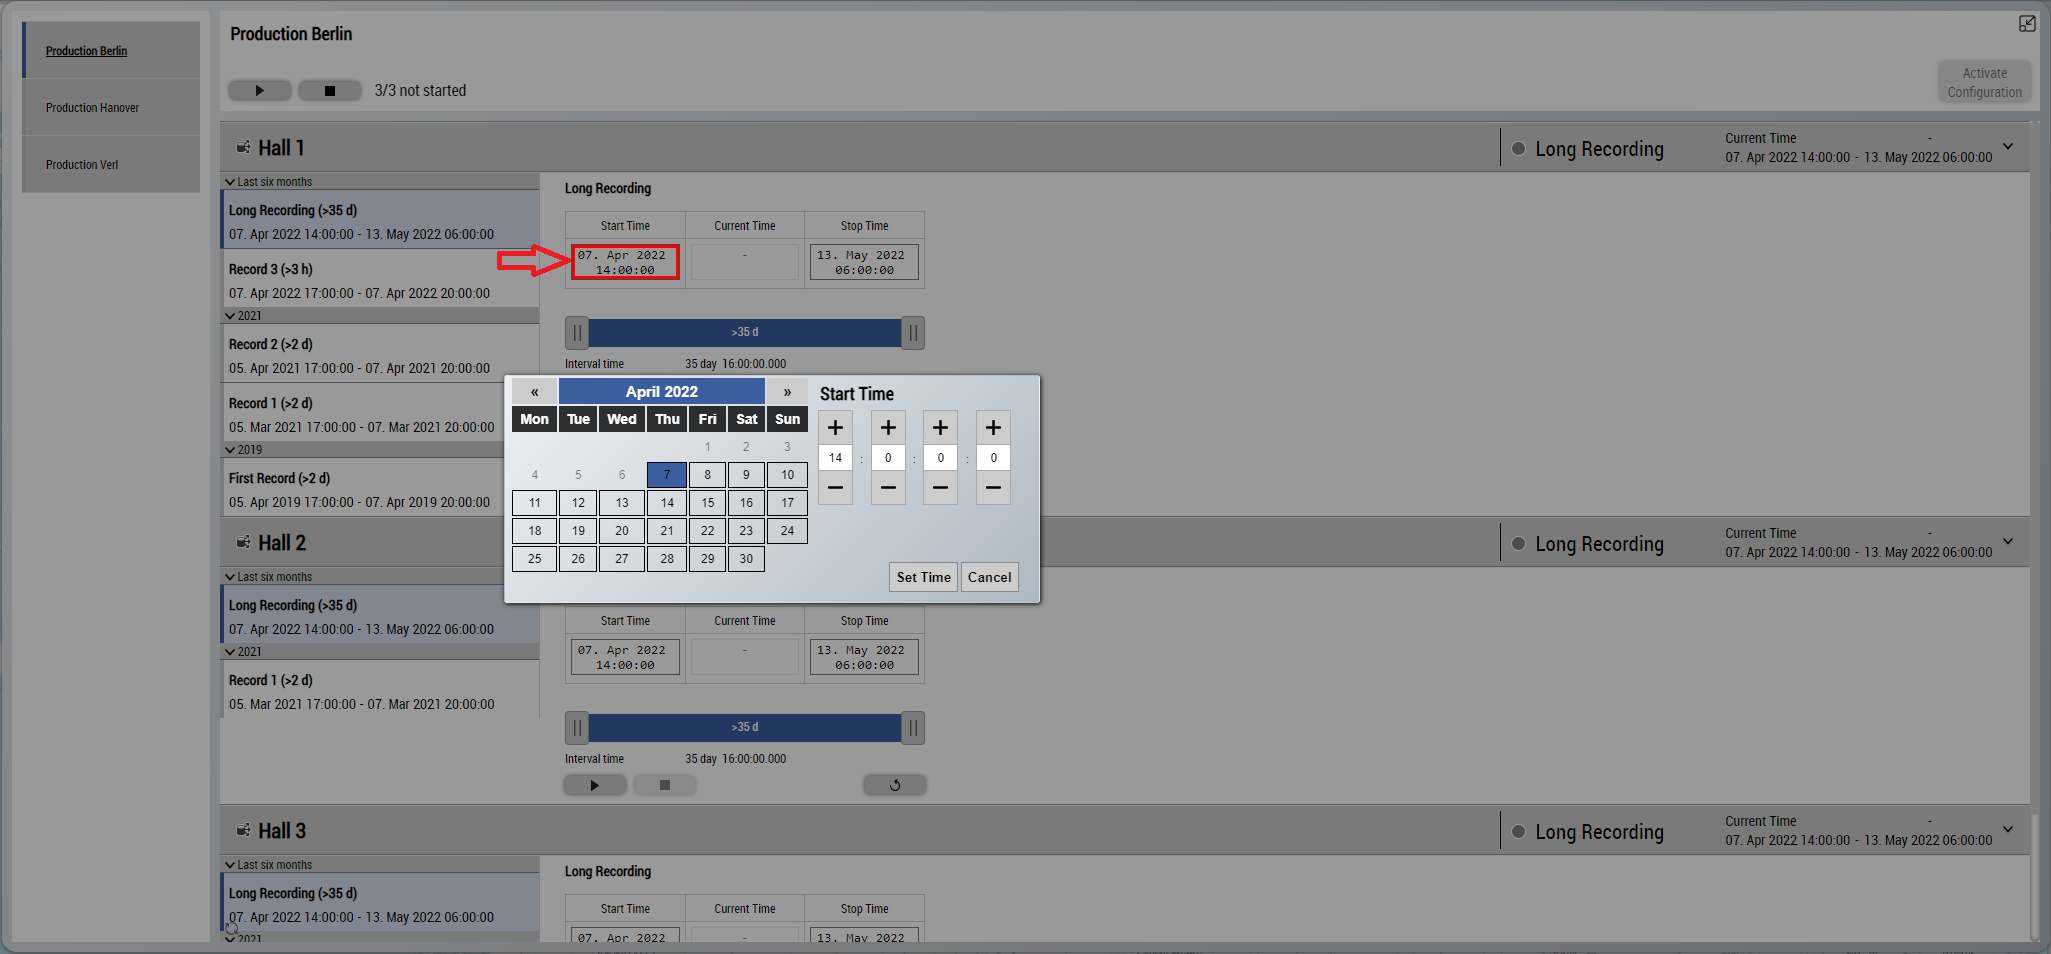
The slider is ideal for quick tests and approximate setting of the start and end times. For an exact setting down to the millisecond, click on the text field. This opens a selection window with calendar for selecting the date and setting the exact time.
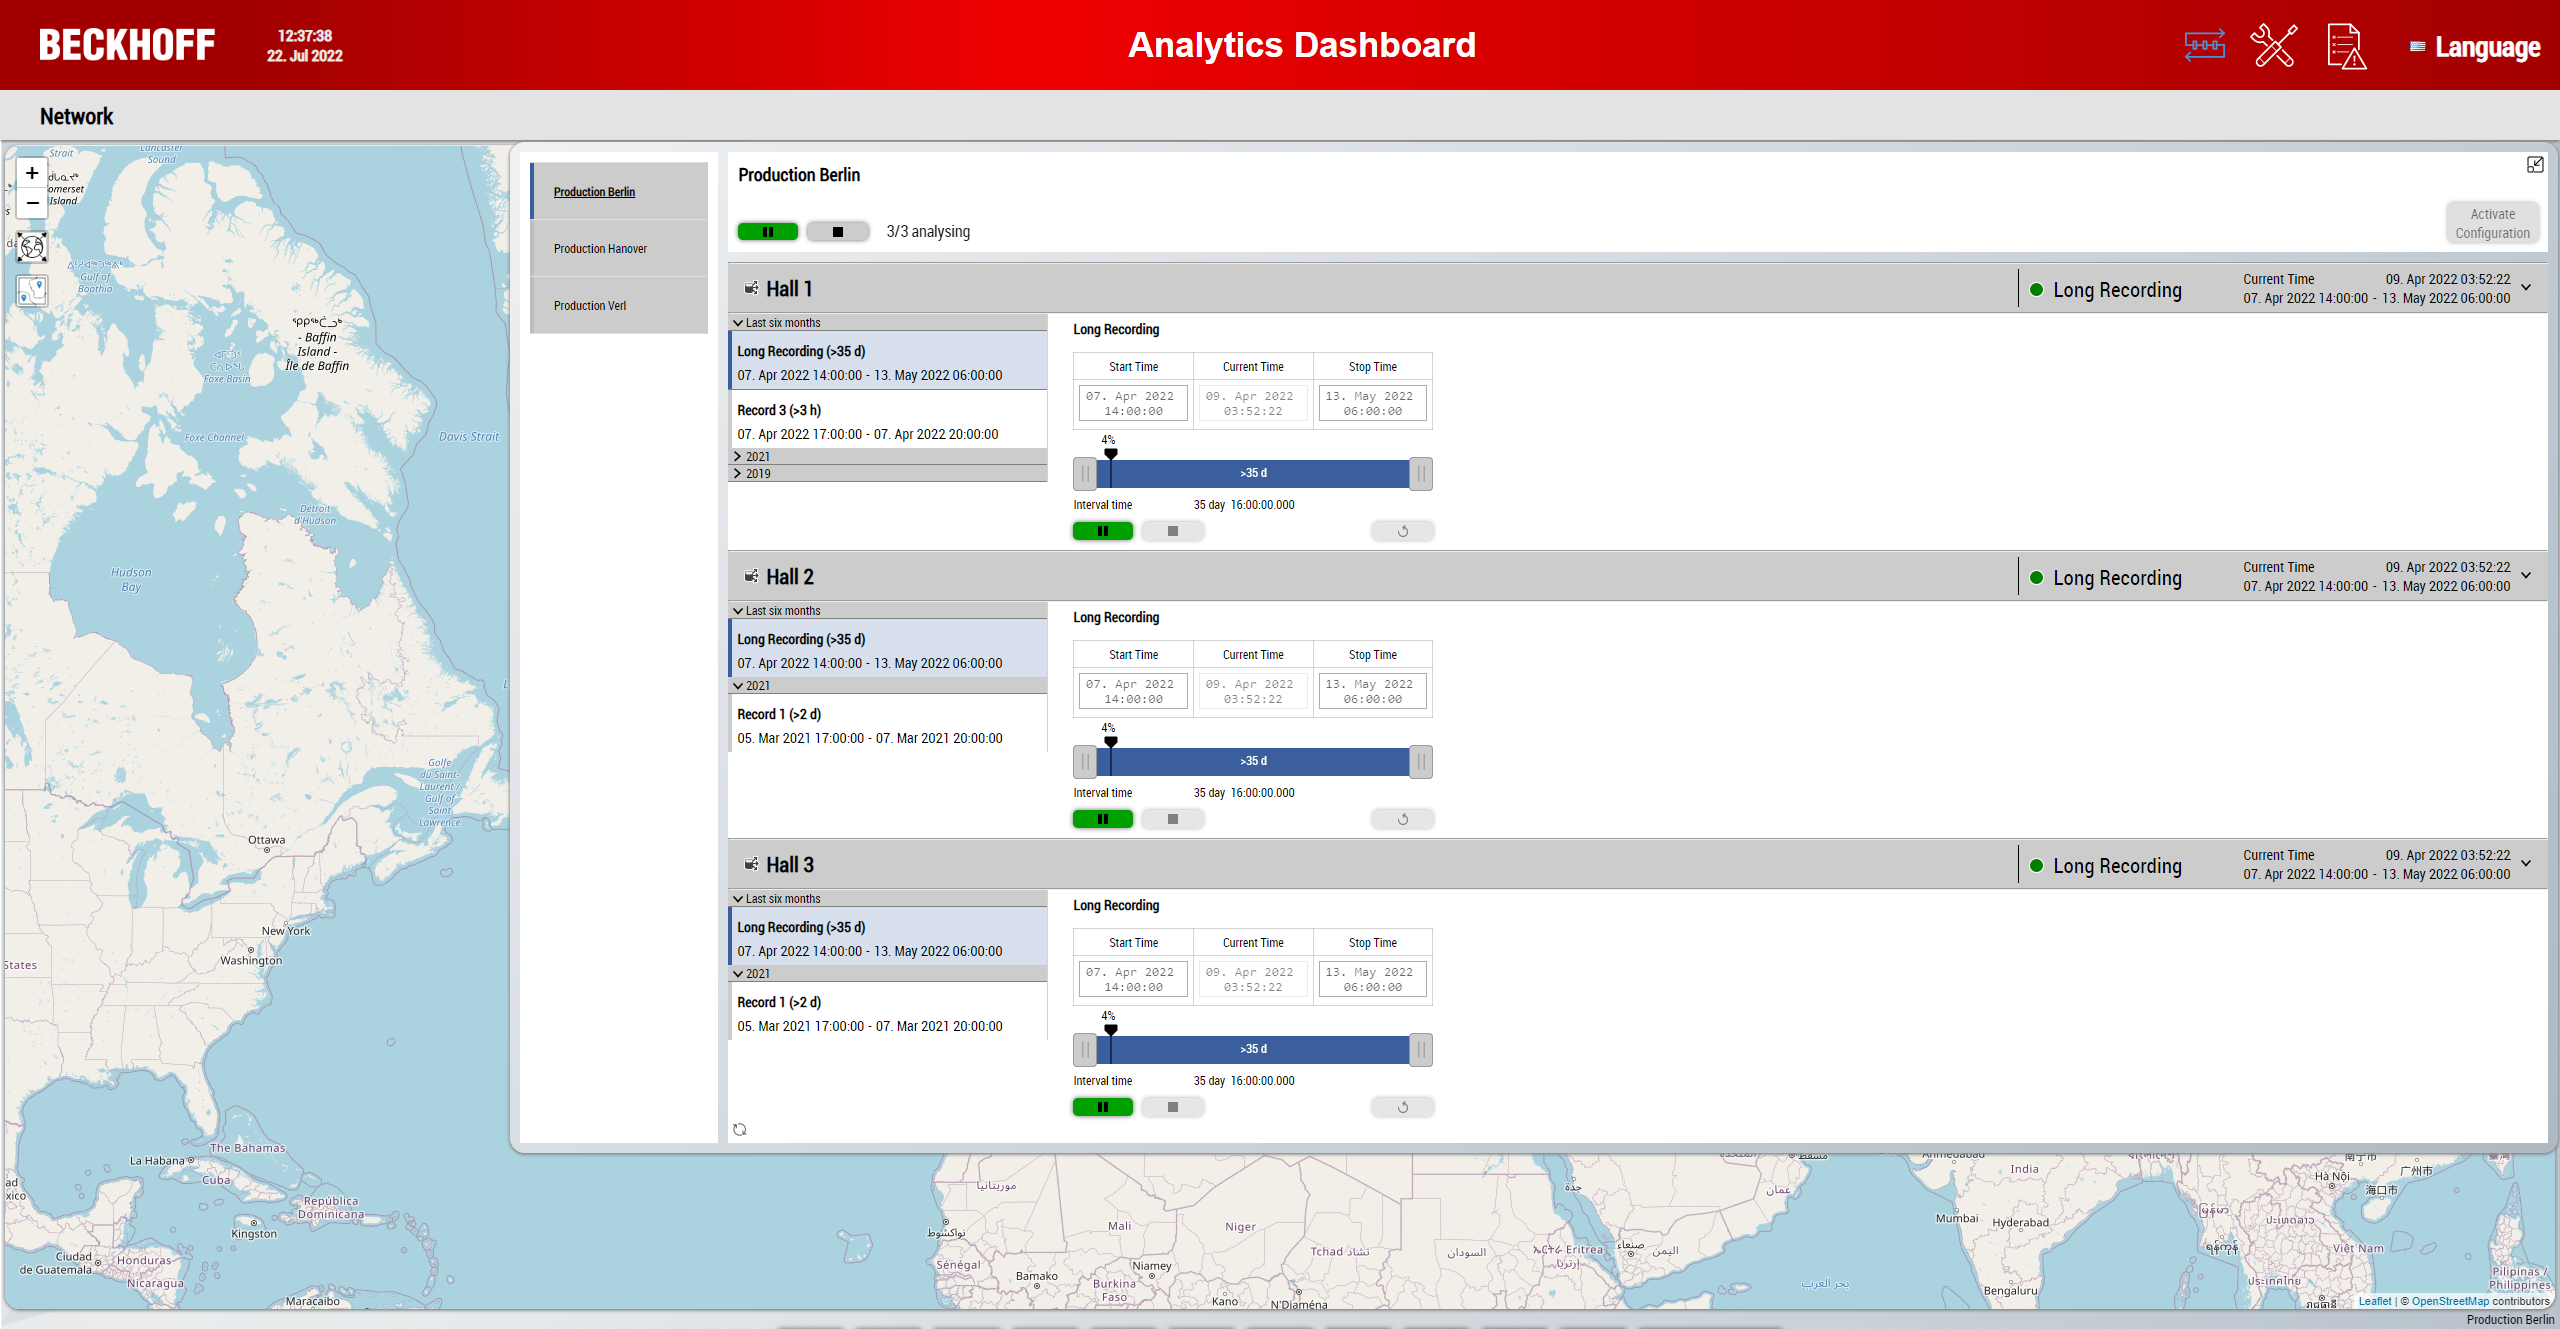
As soon as you click the button Start, the analysis is triggered with all input sources in the PLC. A loading symbol appears for the first time until the analysis starts. It turns green when the first data appears. Likewise, a marker shows the current time of the historical analysis in the slider. The process speed depends on the bandwidth, the number of data and the recorded cycle time. It is possible to analyze several historical recordings at the same time by simply switching machines. Internally, all analyses continue in parallel. This makes it easy to switch between analyses in the dashboard.
The button Minimize in the upper right corner hides the selection of configurations and records. This allows you to work with the records from the input sources and view the data at the same time. You can hide the window completely by clicking the blue icon at the top. Only the configuration name is always in the bottom right corner of the dashboard.