Working with Historical Data
Historical Data can be analysed with the Analytics Workbench or the Analytics Service Tool. To see your recorded data, you need the TwinCAT Target Browser.
Selection of data from the TwinCAT Target Browser
The historical data can be pulled directly from the Target Browser to an input of an analysis algorithm.
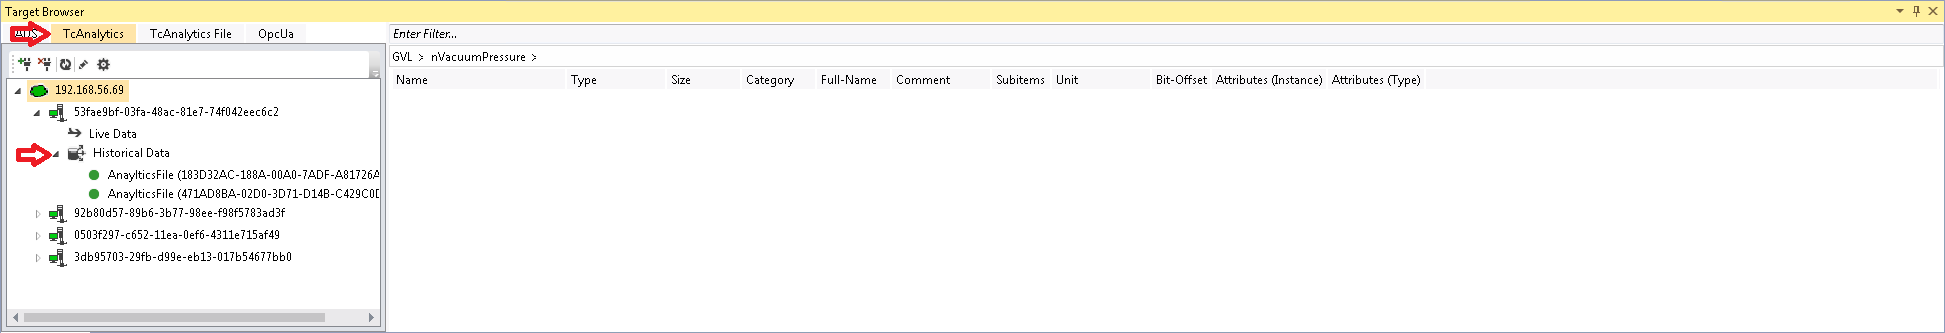
- 1. First, you need to click TcAnalytics in the left corner of Target Browser. There you can see your configured broker, which lists live and historical data from your various devices. This should look like the following figure.
- 2. Go to the historical stream you created and select the recording to be analyzed. All your records are listed in the Record window on the right. The last recording is selected by default.
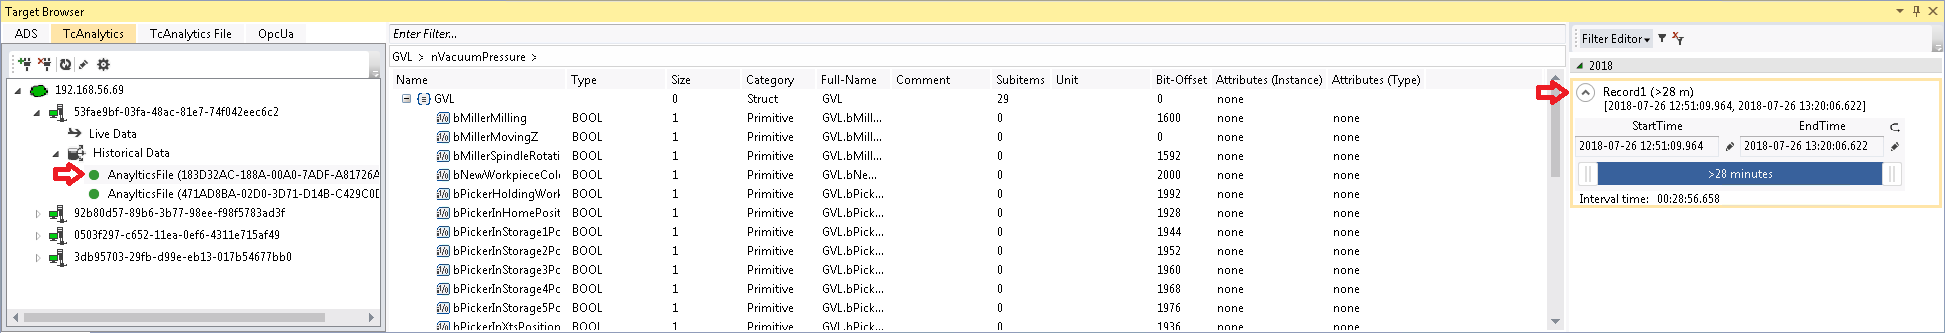
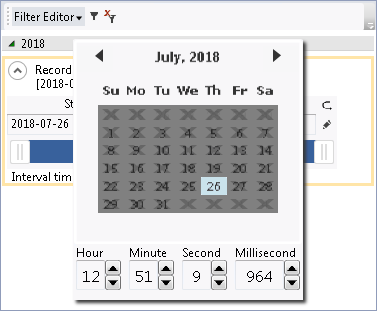
- 3. When you record live, the time range of the recording is updated every few seconds. The entire time range of a recording is used by default. You can also edit the start and end time to analyze your desired data area. This can be done with a slider, text fields or in a graphical calendar view. If you click on the symbol to the right of the text fields, the calendar view will be displayed.
- 4. After these steps, you can drag and drop a symbol to an input of an algorithm just as you do with the symbols of the live data.
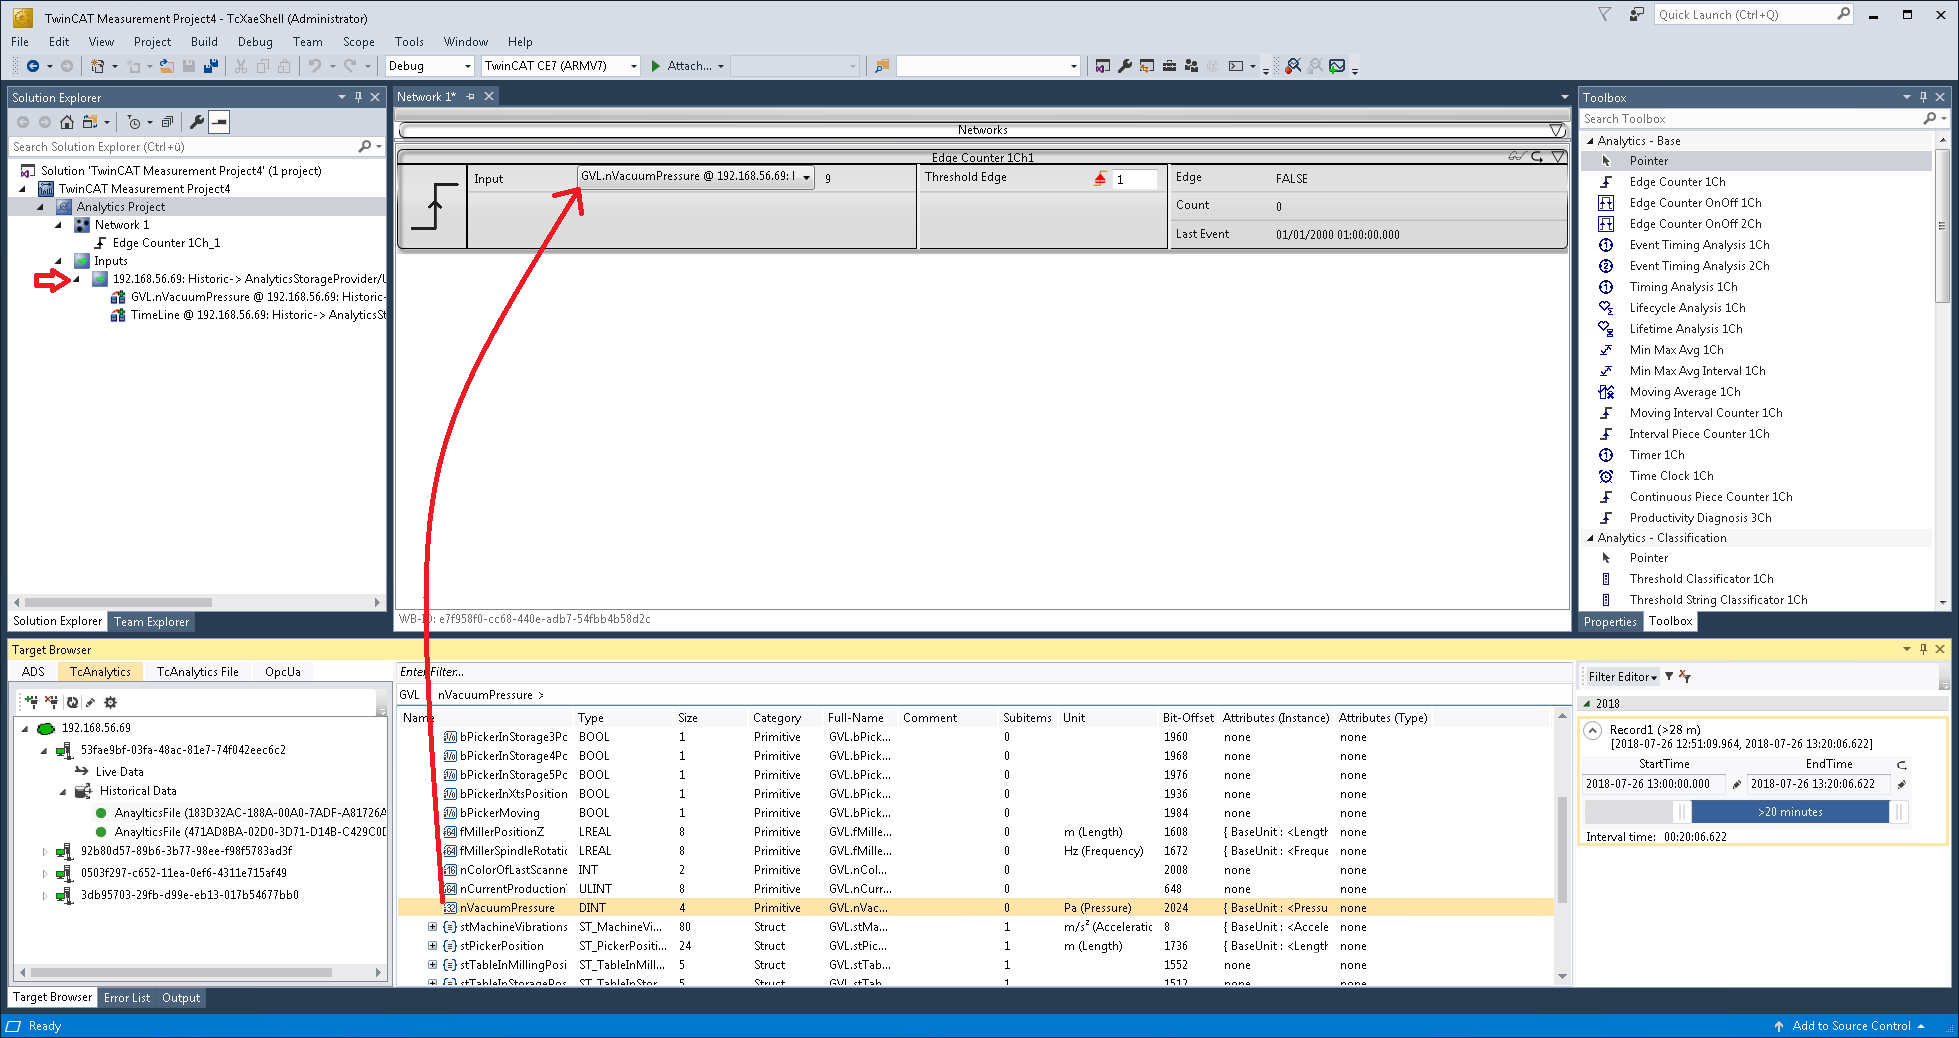
- A new input source for your historical stream is then generated and can be displayed in the Solution Explorer of your Visual Studio. First, the dragged symbol and a timestamp of the current device time are listed under this stream. Also new drawn symbols of this stream are listed there.
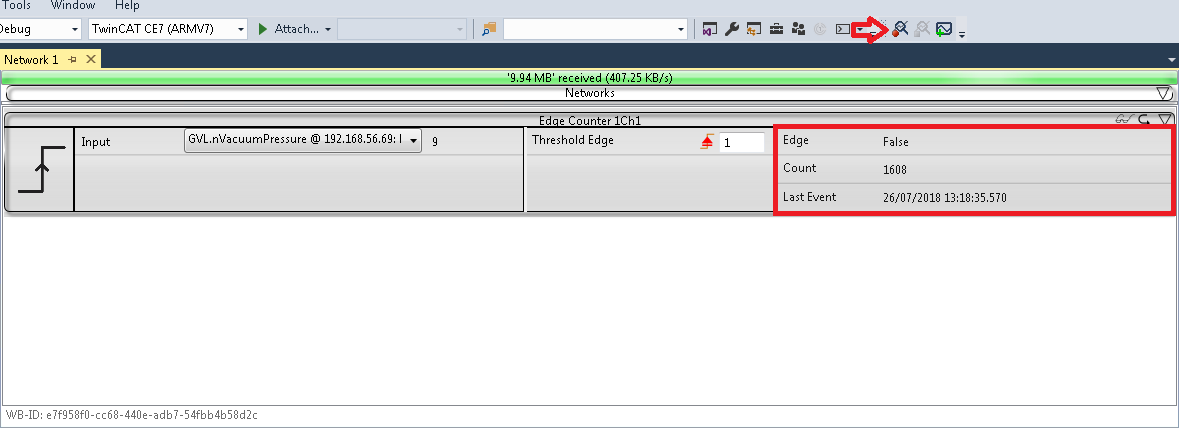
Analyse your historical data in the Analytics Configurator
To analyse your historical data press on the Start Analytics button. In contrast to analysing live data, a green progress bar appears. The speed of your analysis depends on your record length, the amount and size of your symbols as well as on your broadband speed to the broker. The analysis stops automatically when the progress bar ends. The results will remain visible.