Configuration of a chart
A chart is configured in the web browser. You can edit all settings (such as chart type, variables and time periods) via the properties window of the chart.
Open of the chart properties
Open the chart properties by clicking on the title of the Chart control.
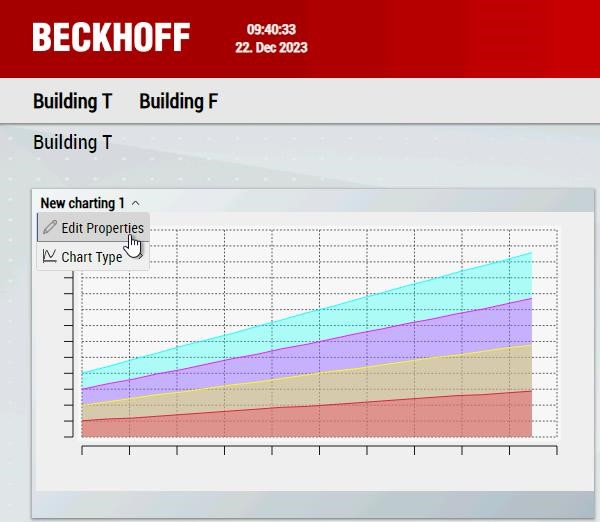
Click on Edit Properties to open the chart properties.
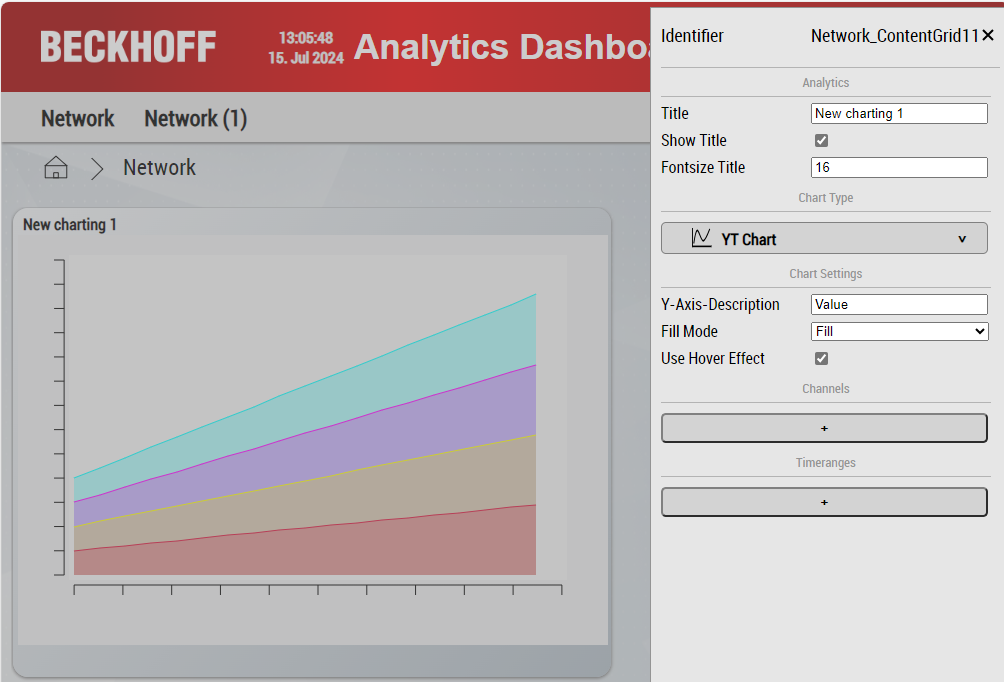
The chart properties are divided into 4 categories.
- Chart Type: Selection of the chart type
- Chart Settings: Configuration of the chart
- Channels: Selection of variables and their display.
- Timeranges: Selection of time ranges to be displayed.
Further Information