General settings
You can make general chart settings in the Chart Settings area.
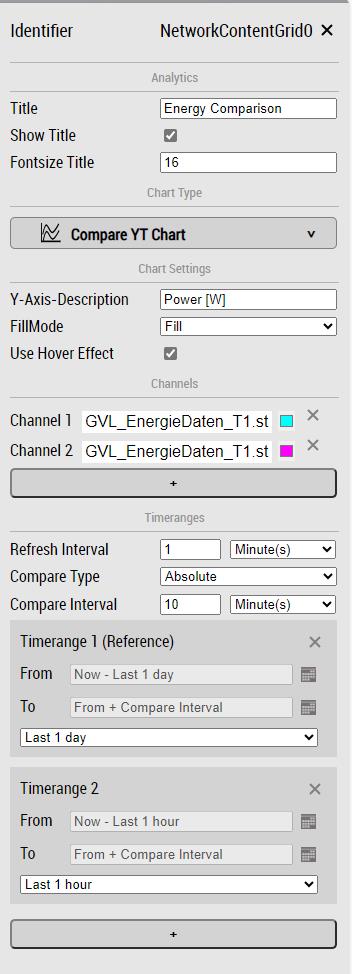
The following options can be set here:
Property | Description |
|---|---|
Y-Axis-Description | Labeling the Y-axis |
FillMode | Selection of whether the graphs should be filled. |
Use Hover Effect | If this option is enabled and the mouse pointer is in the chart, the exact time points and variable values are displayed in a window. |