Chart type
You can set the chart type via the properties of the chart.
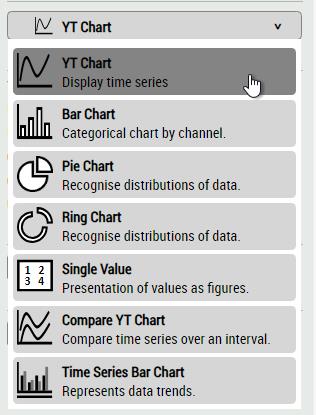
You can use the following chart types:
YT-Chart
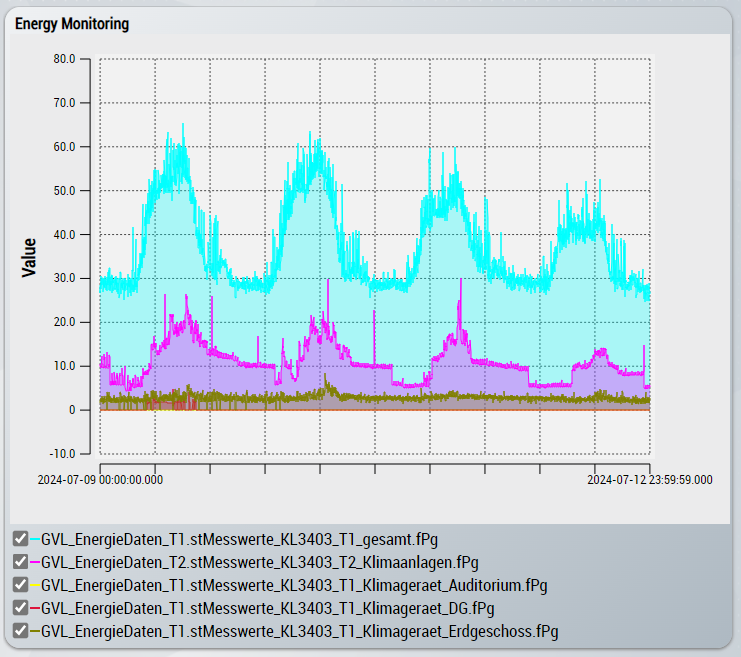
Display of the time on the X-axis and the corresponding values on the Y-axis.
Bar-Chart
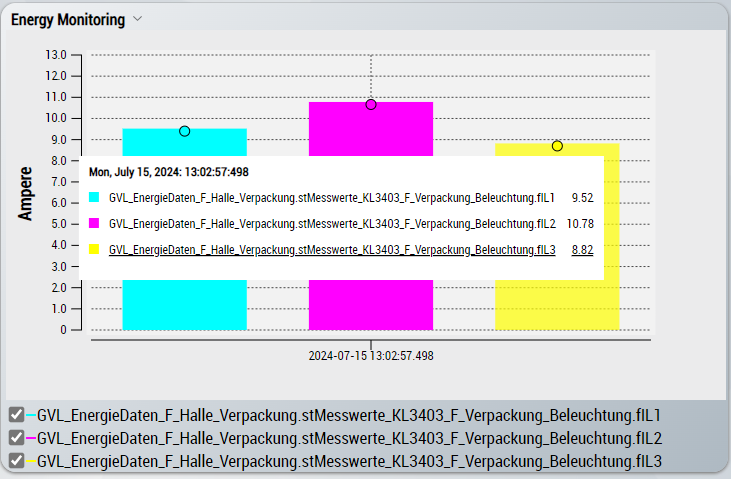
One bar is displayed per selected time range and per variable. The bar represents the last value of the time range.
Pie-Chart
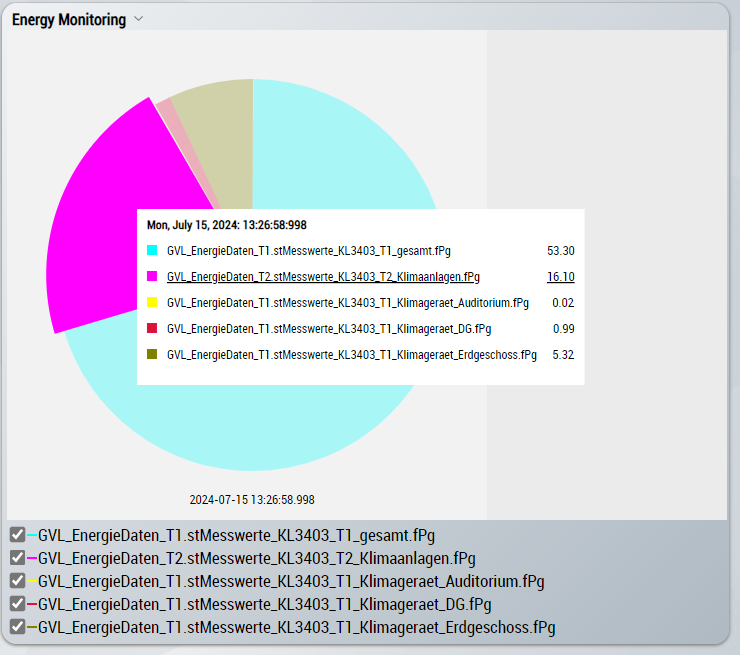
A pie is displayed for each selected time range, which represents the last sample of the time range. Negative variable values are not displayed.
Ring-Chart
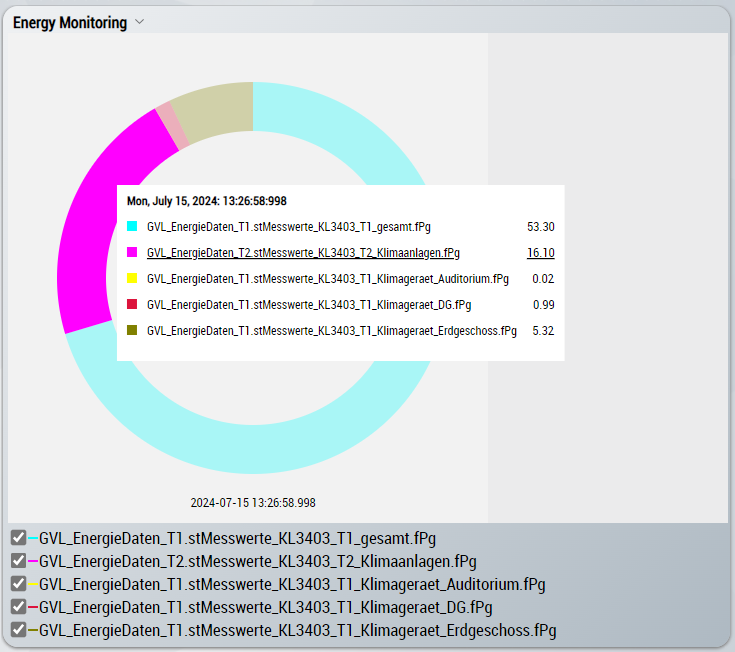
A ring is displayed for each selected time range, which represents the last sample of the time range. Negative variable values are not displayed.
Compare-YT-Chart
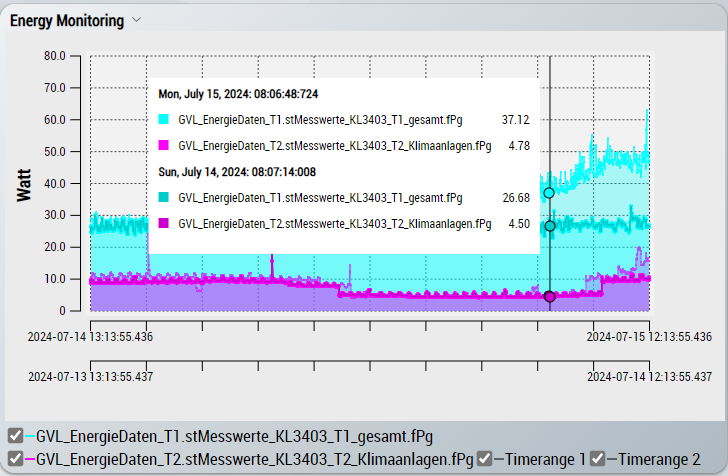
Suitable for comparing several time series. This involves comparing the data over the selected comparison interval. Several comparison modes are available for the comparison. The comparison period is shown on the X-axis.
Time-Series-Bar-Chart
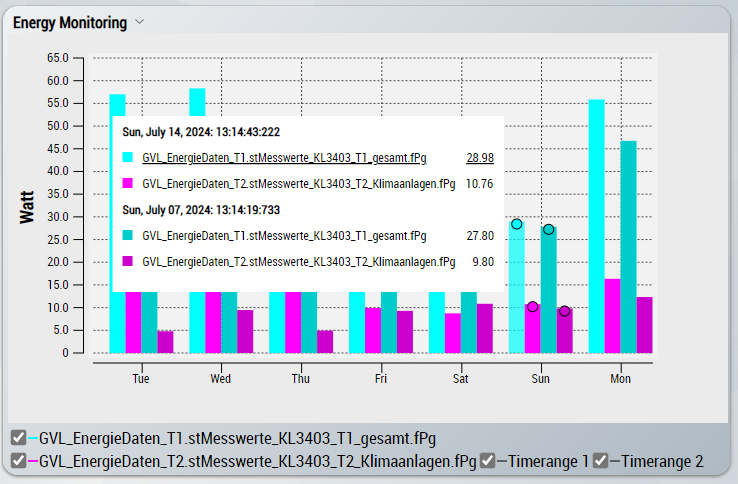
Suitable for comparing several time series. This involves comparing the data over the selected comparison interval. Several comparison modes are available for the comparison. Bar charts are generated per selected timespan and per variable based on the comparison timespan.