Data Track Editor
The Data Track Editor is part of the Analytics Data Scout. It can be used to view data, merge data from different sources and to cut out parts of the data or whole symbols.
Create
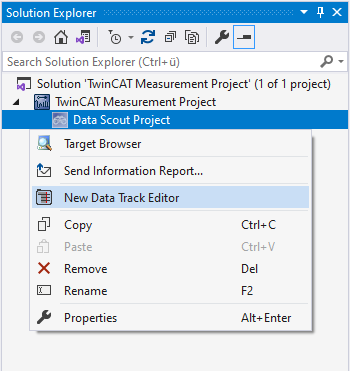
Add a new Track Editor to an Analytics Data Scout by clicking on New Data Track Editor in the context menu of a Data Scout project.
Structure
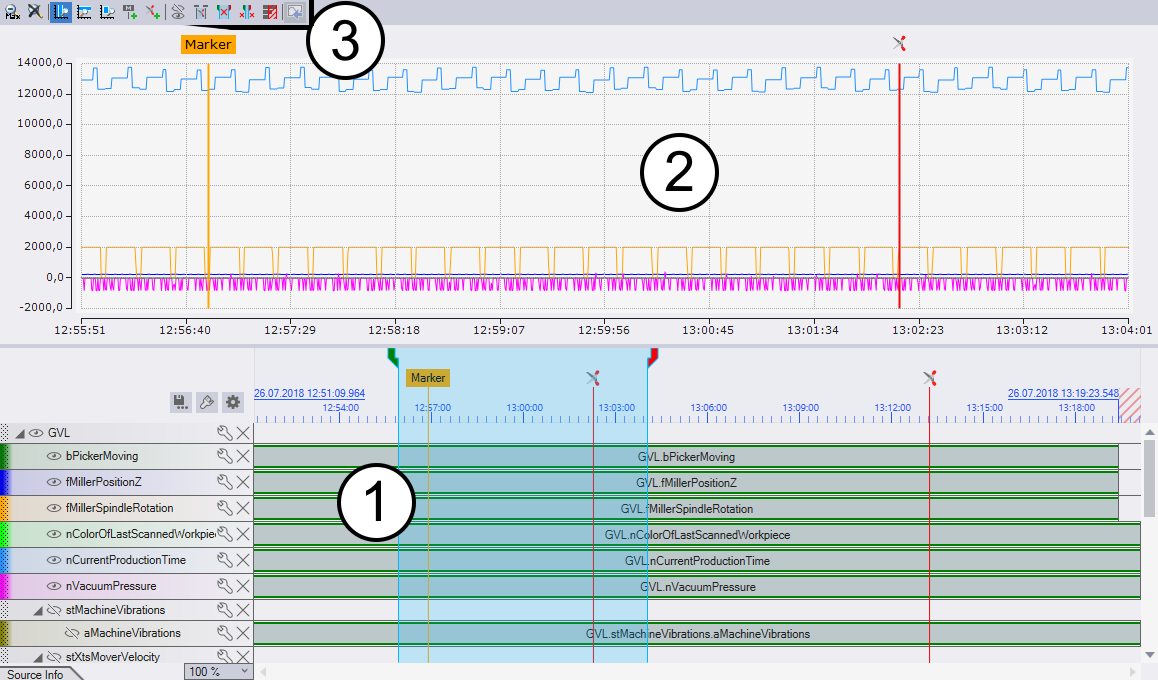
- Tracks represent the symbolism and data in the Data Track Editor.
- The Chart is used to visualize the data lying in the tracks as graphs.
- The Toolbar contains functions for changing the displayed area or cutting out areas, for example.
Click the  button to Export.
Timeline
As different sources can be added in the Track Editor, new times are assigned. The start time and cycle time can be set in the Timeline options. These times are used in the export and in the chart. The start and cycle time of the first added source will be taken over if they have not been set yet.
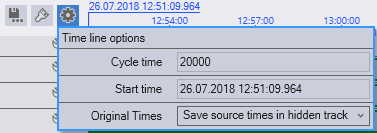
The end time is calculated automatically, using the track with the fewest samples.
Time Tracks
In order not to lose the original times of the sources, time tracks can be generated. How these are generated can be set in the Timeline Options. There are three variants for generating time tracks:
- The time tracks can be generated as visible tracks, and all of them are combined in one container.
- The time tracks are generated in the same way, but they and the container they are located in, are not displayed in the editor.
- No time tracks are created and the original times are discarded during export.
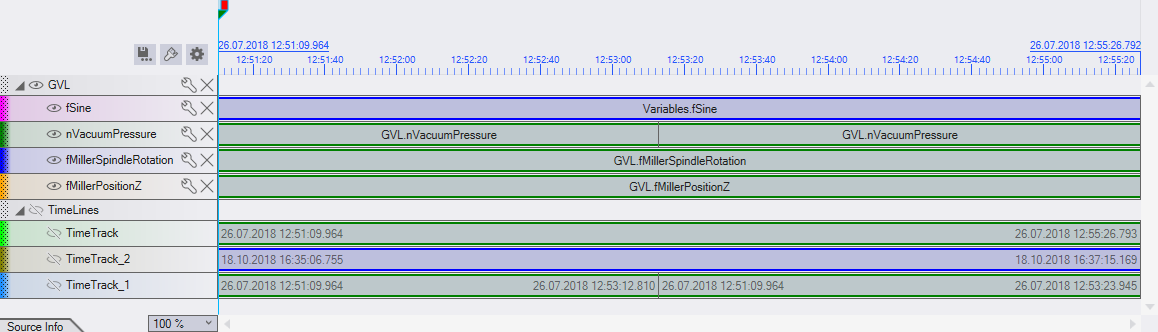
The time track generation works via the data elements of the tracks. There is a time track for each combination of data elements. Only the time range and the source are considered, but not the symbols of the data elements.
In the example illustration, the time tracks were generated visibly. Three were automatically created because three combinations were found in the tracks above. One track with a blue data element, another track with two green data elements, and two more tracks with one green data element.
Time tracks are structured like single tracks. They can contain data items, but these data items have no symbols, only a time range and a source. The start time and end time of the source are displayed in the data elements. If the mouse pointer is positioned over a data element of a time track, the time of the source is shown at the mouse position.