Chart
The Data Track Editor uses a chart similar to the YT chart of the Scope View to visualize the data of the tracks.
The chart has a Y axis on the left and an X axis at the bottom, on which the times are displayed. On these axes, each visible track containing data is represented as a graph.
The time values are reassigned for the chart and the time values from the original sources are not used to represent multiple sources in one chart. The start time as well as the cycle time can be set in the Track Editor Timeline options.
A blue area is displayed in the Track Editor above the timeline and track data elements. This area indicates which area is displayed in the chart. If you zoom in the chart using the toolbar functions or the mouse wheel, the selected area in the tracks also changes. It works the same the other way around, so in the tracks the selected range can be adjusted and the range displayed in the chart changes.
Loading data
As soon as a track with data is in the Data Track Editor, this data is loaded. Loading happens automatically in the background. When loading, the tracks whose composition of data elements is the same, i.e. belong to the same Time Track, are loaded simultaneously. Each time the selected area changes or a new track is inserted, the data for the selected area is updated.
If too much data would be displayed in the chart with a high display width, the data will only be partially displayed.
Load Analytics Files
Analytics Files must be prepared for fast display. In the Target Browser in the Analytics File Extension, a green arrow is displayed at the folder for Analytics Files that are not prepared. Clicking on this arrow opens a new window and the Analytics File is prepared for quick display.
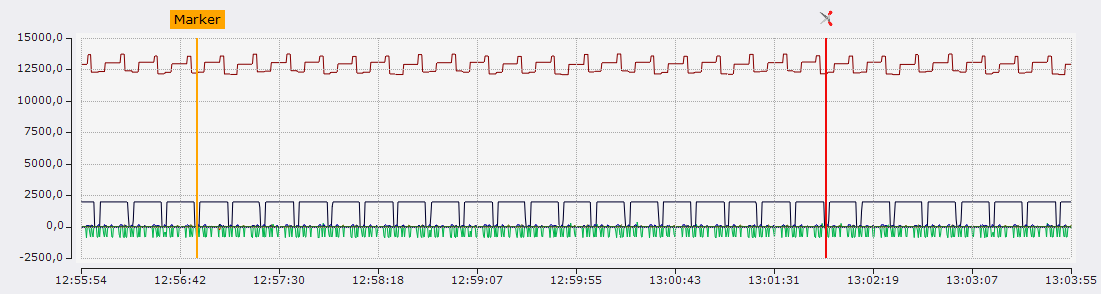
Marker
Markers can be displayed in the chart. These remain at a certain position and can be subsequently moved by clicking and dragging on the X axis.
There are two types of markers. The standard marker has a text above the marker line. The text is highlighted with the same color as the marker line. The second type of marker is intended for cutting out data. There can be only two of these markers in a Data Track editor, if a third is inserted the elimination marker closest to the new one will be removed. Cutout markers have no text above their line, but scissors and the line is always red.
When a marker is clicked with the left mouse button, a tooltip opens showing the time and values at the marker's position. If a marker is clicked with the right mouse button, a context menu is opened. In this there is an option to remove the marker from the Data Track Editor.