Bar axis properties
All the settings for the axes of array bar charts are described here.
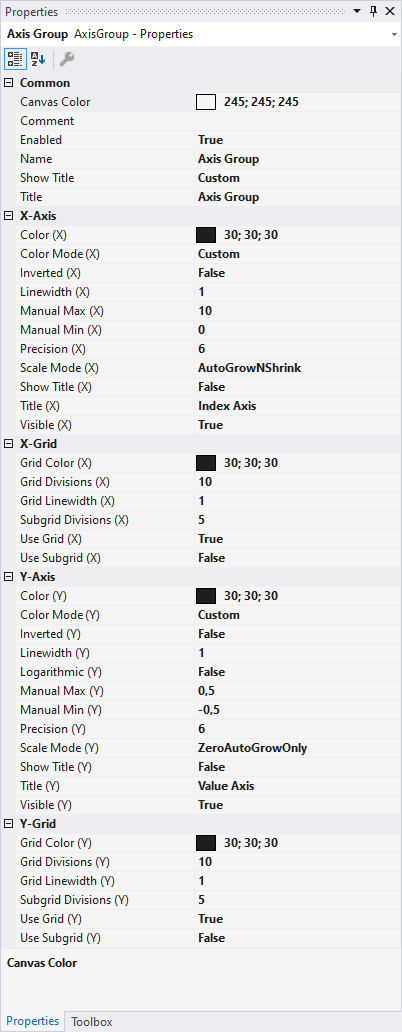
Common
Canvas Color | Defines the color of the chart. |
Comment | A free comment can be saved here. |
Enabled | Here you can switch the axis on or off completely. This functionality is also available via the context menu. |
Name | Defines the name of the axes. |
Show Title | Determines which title is displayed above the chart. This function is only displayed if there is only one axis group, or if the axis groups are not stacked. Hide: no title is displayed Custom: the value from the 'Title' setting is displayed Name: the name of the axis group is selected X-Axis Title: the title of the X-axis is reused Y-Axis Title: the title of the Y-axis is reused First Channel: the name of the first channel is reused Below that, all channels are listed in order to select them explicitly. |
Title | If Shot Title is set to 'Custom', this title will be displayed above the chart. |
X-axis
Color (X) | Color of the axis. |
Color Mode (X/Y) | Defines which color is displayed at the axis. Custom: the value from the 'Color Mode' setting is displayed First Channel: the name of the first channel is reused Below that, all channels are listed in order to select them explicitly. |
Inverted (X) | Axis inversion. |
Linewidth (X) | Line width in pixels |
Manual Max (X) | If Auto Scale is inactive, the maximum value can be edited directly. |
Manual Min (X) | If Auto Scale is inactive, the minimum value can be edited directly. |
Precision (X) | Here you can specify the number of significant digits for the axis labeling. It corresponds to the number of visible digits on the axis. |
Scale Mode (X) | Two Auto Scale modes are available for selection. The default mode is AutoGrowOnly. This means the X-axis always scales to the historic maximum, until a rescale is carried out for the current view. Alternatively, select AutoGrowNShrink. This mode always automatically adjusts the maximum of the X-axis to the maximum in the current view (display width). |
Show Title (X) | Specifies whether the name of the X-axis is shown in the chart. |
Title (X) | Here you can enter an X-axis label. |
Visible (X) | Specifies whether the axis is shown or hidden in the chart. |
X-Grid
Grid Color (X) | Color of the grid. |
Grid Divisions (X) | Maximum number of subdivisions. If there is not enough space for the selected number of ticks, these are automatically reduced in the chart. |
Grid Linewidth (X) | Line width of the grid in pixels. |
Subgrid Divisions (X) | Number of areas into which the main grid is subdivided by auxiliary lines. |
Use Grid (X) | The X-subdivisions of the axis can be shown or hidden here. |
Use Subgrid (X) | Auxiliary lines for the finer X-subdivision of the main grid can be shown or hidden here. Auxiliary lines have no axis labeling. |
Y-axis
Color (Y) | Color of the axis. |
Inverted (Y) | Axis inversion. |
Linewidth (Y) | Line width in pixels. |
Logarithmic (Y) | Switches between logarithmic and linear scaling of the axes. |
Manual Max (Y) | If Auto Scale is inactive, the maximum value can be edited directly. |
Manual Min (Y) | If Auto Scale is inactive, the minimum value can be edited directly. |
Precision (Y) | Here you can specify the number of significant digits for the axis labeling. It corresponds to the number of visible digits on the axis. |
Scale Mode (Y) | Two Auto Scale Modes are available for selection. The default mode is AutoGrowOnly. This means the y-axis always scales to the historic maximum, until a rescale is carried out for the current view. Alternatively, AutoGrowNShrink can be selected. This mode always automatically adjusts the maximum of the y-axis to the maximum in the current view (display width). |
Show Title (Y) | Specifies whether the name of the y-axis is shown in the chart. |
Title (Y) | Here you can enter an y-axis label. |
Visible (Y) | Specifies whether the axis is shown or hidden in the chart. |
Y-Grid
Grid Color (Y) | Color of the grid. |
Grid Divisions (Y) | Maximum number of subdivisions. If there is not enough space for the selected number of ticks, these are automatically reduced in the chart. |
Grid Linewidth (Y) | Line width of the grid in pixels. |
Subgrid Divisions (Y) | Number of areas into which the main grid is subdivided by auxiliary lines. |
Use Grid (Y) | The Y-subdivisions of the axis can be shown or hidden here. |
Use Subgrid (Y) | Auxiliary lines for the finer Y-subdivision of the main grid can be shown or hidden here. Auxiliary lines have no axis labeling. |
To change the settings for several axes at the same time, please refer to the chapter Multiple selection.