XYZ chart properties
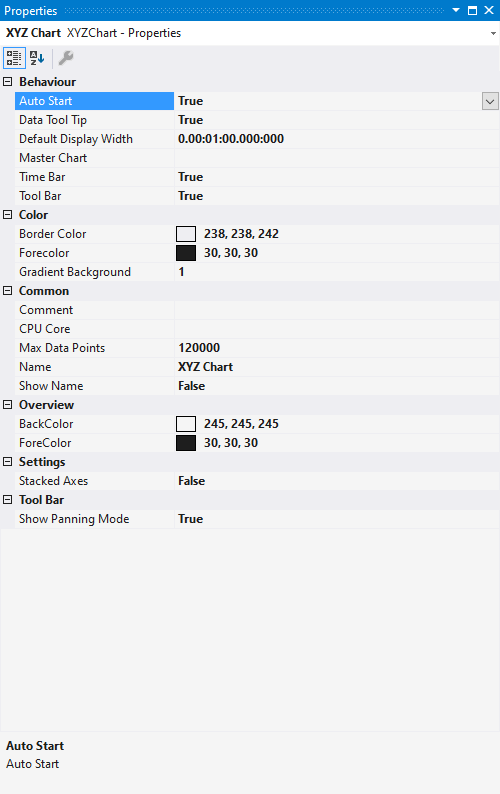
Behaviour
Auto Start | If this option is enabled, the chart starts the live display when a new recording is started. |
Data Tool Tip | If this option is enabled, clicking on a data point displays the exact value, the timestamp and the name of the corresponding channel in the upper left corner. |
Default Display Width | This time specifies the standard width of the associated chart. This value is set, for example, when the rescale button is selected in the chart toolbar. |
Master Chart | In the drop-down list that is available here, a chart that is part of the current configuration can be selected and designated as master chart. All actions that are executed in the master chart are also automatically executed in this chart. A separate pause option is provided, through which Y-zoom and Y-panning modes are available. An overview chart can also be displayed. |
Time Bar | Specifies whether the time bar is displayed in the chart. |
Tool Bar | Specifies whether the toolbar is displayed in the chart. |
Color
The background and frame color can be set by means of color dialogs.
Common
Comment | A free comment can be saved here. |
CPU Core | Here you can set (for each chart individually) which CPU core should be used for the current chart display. If required, multiple CPU cores can be specified for a chart. This may improve the performance. |
Max Data Points | Determines the maximum number of data points that can be displayed at the same time. The default value is 120,000. This means that, at a sampling rate of 1 ms (TaskSampleTime), the maximum recording time for which values can be displayed simultaneously is 2 minutes. |
Show Name | Specifies whether the name of the chart is shown in the graph. |
Settings
Stacked Axes | Defines the stacking direction for axes. False for horizontal stacking of the axes and true for vertical stacking. |
Tool Bar
Show Panning Mode | Specifies whether the button for toggling the ALT functionality is displayed in the toolbar. |