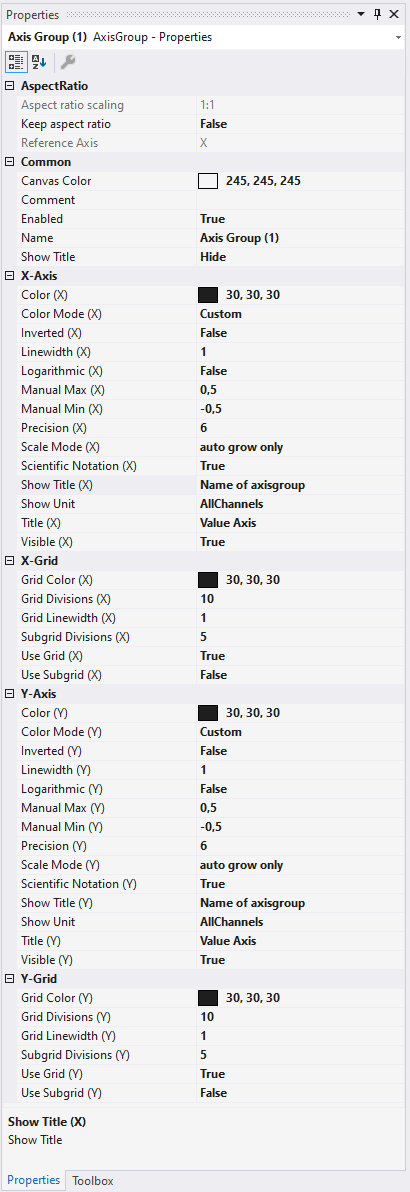
XY axis properties
Here you can implement separate settings for each available XY-axis.
AspectRatio
Aspect ratio scaling | Aspect ratio between the axes. |
Keep aspect ratio | Enables the function to maintain the aspect ratio between the axes. |
Reference Axis | Specifies the axis that defines the scaling. |
Common
Canvas Color | Defines the color of the chart. |
Comment | A free comment can be saved here. |
Enabled | Here you can switch the axis on or off completely. This functionality is also available via the context menu. |
Name | Specifies whether the name of the X-axis is shown in the chart. |
Show Title | Determines which title is displayed above the chart. This function is only displayed if there is only one axis group, or if the axis groups are not stacked. Hide: no title is displayed Custom: the value from the 'Title' setting is displayed Name: the name of the axis group is selected X-Axis Title: the title of the X-axis is reused Y-Axis Title: the title of the Y-axis is reused First Channel: the name of the first channel is reused Below that, all channels are listed in order to select them explicitly. |
Title | If Shot Title is set to 'Custom', this title will be displayed above the chart. |
(X/Y) Grid
Grid Color (X/Y) | Color of the grid. |
Grid Divisions (X/Y) | Number of subdivisions. |
Grid Linewidth (X/Y) | Line width of the grid in pixels. |
Subgrid Divisions (X/Y) | Number of areas into which the main grid is subdivided by auxiliary lines. |
Use Grid (X/Y) | The X-subdivisions of the axis can be shown or hidden here. |
Use SubGrid (X/Y) | Auxiliary lines for the finer X-subdivision of the main grid can be shown or hidden here. Auxiliary lines have no axis labeling. |
(X/Y)-Axis
Color (X/Y) | Color of the axis. |
Color Mode (X/Y) | Defines which color is displayed at the axis. Custom: the value from the 'Color Mode' setting is displayed First Channel: the name of the first channel is reused Below that, all channels are listed in order to select them explicitly. |
Inverted (X/Y) | Inverts the direction of the axis. |
Linewidth (X/Y) | Line width in pixels. |
Logarithmic (X/Y) | Switches between logarithmic and linear scaling of the axes. |
Manual Max (X/Y) | Maximum value for manual scaling. |
Manual Min (X/Y) | Minimum value for manual scaling. |
Precision (X/Y) | Here you can specify the number of significant digits for the axis labeling. Corresponds to the number of digits on the axis. |
Scale Mode (X/Y) | Specifies the Scale Mode for the axis. There are three modes to choose from. In case of Manual, the range of the axis can be fixed. AutoGrowOnly automatically increases the area of the axis, if data points are out of range. AutoGrowNShrink further shrinks the range if extreme values in the data are no longer in the displayed time range. |
Show Title (X/Y) | Determines which title is displayed on the axis Hide: no title is displayed Custom: the value from the 'Title (t/Y)' setting is displayed Name of axisgroup: the name of the axis group is selected First Channel: the name of the first channel is reused All channels are listed below and a channel can be explicitly selected. |
Show Unit (X/Y) | Determines whether the unit should also be displayed as an axis label. Hide: No unit is displayed. AllChannels: All units configured channels are displayed. If different units are used, the units are separated by a comma. |
Title (X/Y) | Axis title. |
Visible (X/Y) | Specifies whether the axis is shown or hidden in the chart. |
To change the settings for several axes at the same time, please refer to the chapter Multiple selection.