Display in the Real-time Monitor
In simple terms, the TwinCAT 3 Real-time Monitor enables the display of grouped events. In order to avoid confusion with the messages or alarms stored in the TwinCAT EventLogger, the data handled by the TwinCAT 3 Real-time Monitor are referred to as (time) markers.
These markers can be used to represent the temporal behavior of tasks or user processes. For this purpose, the markers are assigned an ID, a marker type, a context and a timestamp. In addition, if required a user-defined date formatted as UINT can be provided, in order to include additional information in the display in the real-time monitor (e.g. error number, state of a state machine etc.).
Marker ID:
The marker ID is used to identify the displayed task / process. In other words, all markers relating to the same task/process should use the same marker ID.
Marker type:
The TwinCAT 3 Real-time Monitor enables the display of events or processes / operations over time. For the representation of processes / operations, these are marked as a sequence. A sequence can be divided into one or more intervals. Markers can be typed to define the start or end of sequences or intervals. In addition, they can also show events within an application over time. A distinction is therefore made between the following types of markers:
- Marker:
The marker can be used to log an event, e.g. the time of an alarm or the change of a state etc. - Sequence start:
A sequence start indicates the time when a task / process is allowed to start (higher-priority tasks / processes may result in a delay). - Interval start:
An interval start specifies the time when a task / process actually starts. Due to interruptions etc., a sequence may contain several interval starts. - Interval stop:
An interval stop specifies the time when a task / process is no longer executed. This can happen, for example, due to interruptions caused by higher-priority tasks or unfulfilled dependencies. - Sequence stop:
A sequence stop indicates the point in time at which a task may no longer run or a process is terminated.
Context:
A context describes a summary of markers or marker groups.
For the system tasks, all tasks that are processed on a core are combined into one context (e.g. core 0). Such a (real-time) context thus maps the scheduling within a real-time kernel. For these real-time contexts, only one of the tasks assigned to a context is active at any one time. This restriction does not apply to user-specific marker groups.
When using simple markers (by using FB_Mark), the user-specific marker groups are automatically grouped according to their application ports. For example, all markers stored from within a PLC project with port 851 are assigned to a context with context ID 851 (hexadecimal 0x353).
When using more complex markers (based on the function block FB_RTMon_LogMarkBase), contexts (i.e. correlations) can be defined independently. This could be, for example, a grouping by process type or by machine modules (functional units).
Display in the tree view:
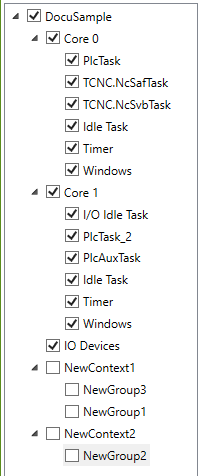
As described above, all markers that describe the same task / process use the same marker ID. These markers are combined into a marker group and are assigned an entry in the tree view of the TwinCAT 3 Real-time Monitor.
An entry with the corresponding task name is automatically created in the tree for the system tasks.
For user-related marker groups that describe processes, for example, this must be done manually. For each detected user-specific marker group an entry NewGroup automatically appears in the tree, which can be identified by the marker ID (corresponds to the group ID in the Properties window of the group). This group can be renamed as required (see Context node).
As described under Display in the Real-time Monitor, the individual marker groups are combined into contexts. This happens automatically for the system tasks and when simple markers are used. When using extended markers, the context ID that is transferred in the application code is used for this purpose.
 | The names of marker IDs (group IDs) and contexts can be exported for later reuse and subsequently re-imported. |
In the chart display, a marker group (i.e. all markers of a task / process) is shown within one row. For more information see Display in the Real-time Monitor.
Chart display:
Symbols in the chart display:
| Sequence start |
| Sequence stop |
| Indicates an interval start or stop. |
| Marker |


Example display:
The following diagram shows an example of a possible temporal behavior of a task. At time (1), the task receives "permission" to run based on the set cycle time. The start may be delayed until time (2) due to missing dependencies or due to higher priority tasks that are still active. At time (3) a marker was transferred. This can be a "system event" marker or a user-defined marker. Detailed information is provided by a tooltip associated with the marker. The marker itself has no influence on the temporal behavior of the task / process. At time (4) the task is interrupted (once again for example due to an interlock or a higher-priority task). At time (5) the task continues to run. At time (6) the task is finished.
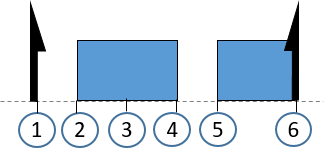
Illustration of the processing of a PLC runtime module:
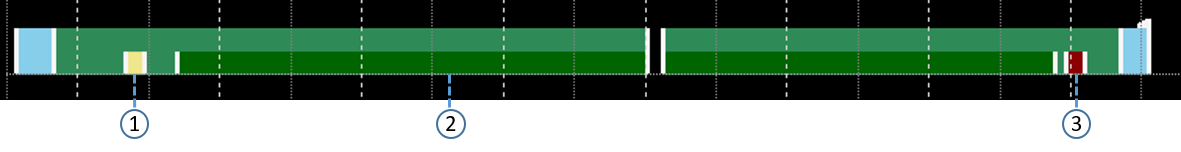
As described in section Real-Time, each PLC runtime module calls the update of the inputs and outputs itself. The complete processing of the PLC takes place in the cyclic update of the task calling it. For this reason, if detailed logging is activated, processing of the PLC is mapped in the cyclic update of a task. The following figure illustrates this by means of an example. Time (1) shows the execution of the input update of the PLC runtime module. Cyclic processing of the PLC code takes place in area (2), which is interrupted by another task in the example shown here. Once processing is completed, the output update of the PLC runtime module takes place at time (3). In the example shown here, the task itself does not perform an input or output update.
Detailed logging:
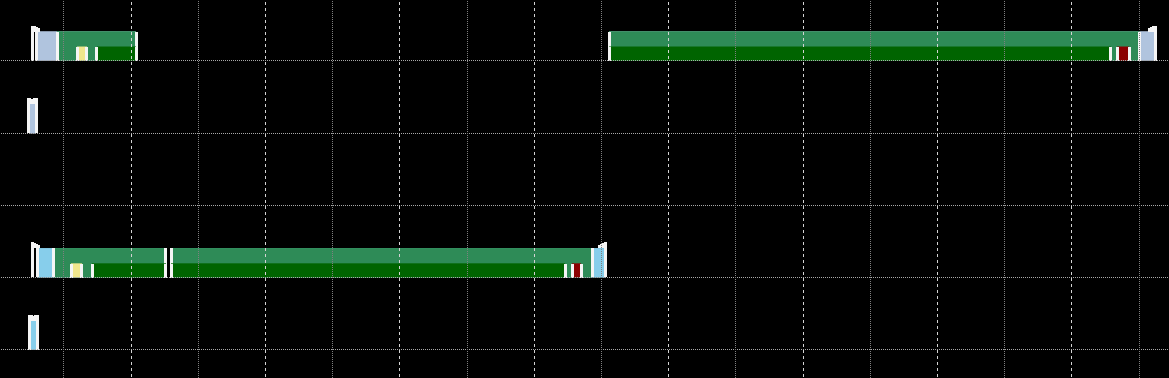
The option "detailedLogging" (see Project node or Context node) offers a detailed representation of the execution of real-time tasks (also within a task). The following two figures illustrate the difference.
Standard logging enabled:
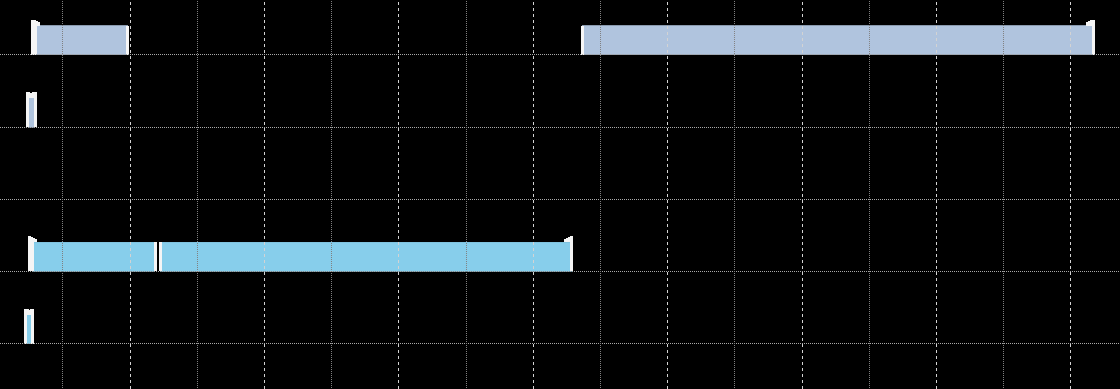
DetailedLogging enabled:
Representation of the task references:
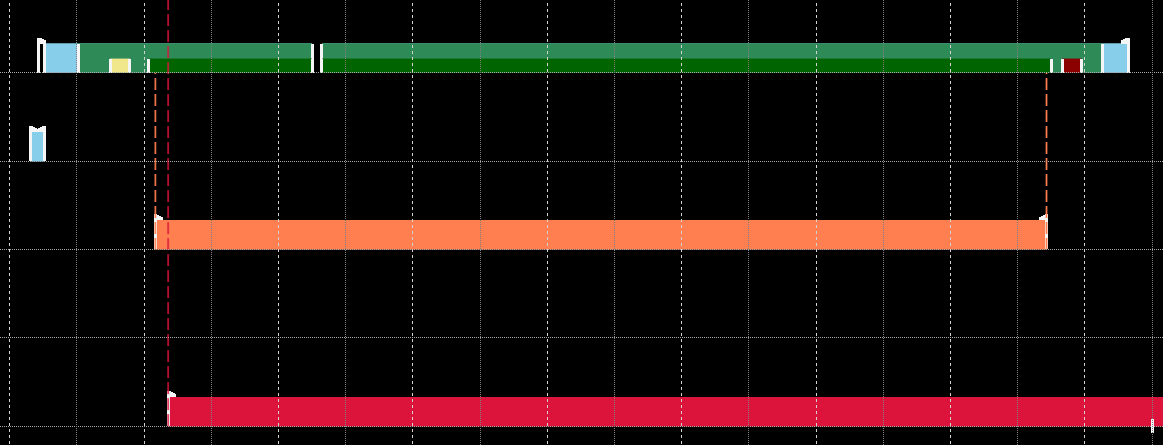
The option Show Task Reference (see Marker group element) enables the assignment of user processes to the tasks on which they are executed to be made visible in the TwinCAT 3 Real-time Monitor. This is represented by dashed lines. The following figure shows the assignment of the user process shown in orange to a PLC task.