Monitoring in Programming Objects
- You have loaded a project into the controller and started it.
You wish to observe the current values that the variables on the controller adopt in the TwinCAT development system in the editors of the programming blocks.
- 1. Make sure that the option Enable inline monitoring is activated in the menu Tools > Options in the category TwinCAT > PLC Environment > Text editor on the tab Monitoring.
- 2. Select the command Decimal in the menu PLC > Display Mode to set the display format of the values.
- 3. Double-click on the POU in the PLC project tree in the Solution Explorer to open the associated editor.
- You can see the representations of the variable values in the declaration part and implementation part. And you will find a general description of this plus the special features that depend on the type of POU and the programming editor.
Monitoring in the declaration editor
The current value of a variable is displayed in the column Value. You can write and force the value entered in the column Prepared value. Forced values are preceded by a red symbol  .
.
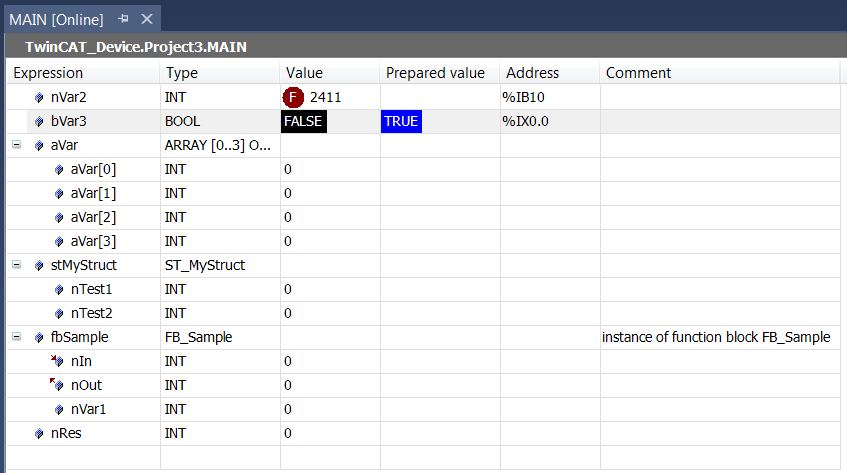
The printout of an interface reference is expandable. If the interface points to a global instance, this global instance is displayed as the first entry under the reference. If the interface reference changes afterwards, the displayed reference collapses.
See also:
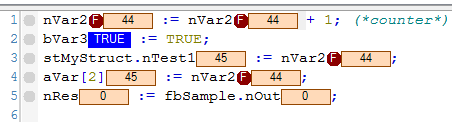
Monitoring in implementation (inline monitoring)
The display of the current variable value in the implementation part is called inline monitoring. The following displays are possible, depending on the programming language:
- Variables have a window with the current value displayed behind their name:
If you have prepared values for forcing or writing for variables, these are displayed within the inline monitoring window behind the current value in angle brackets.
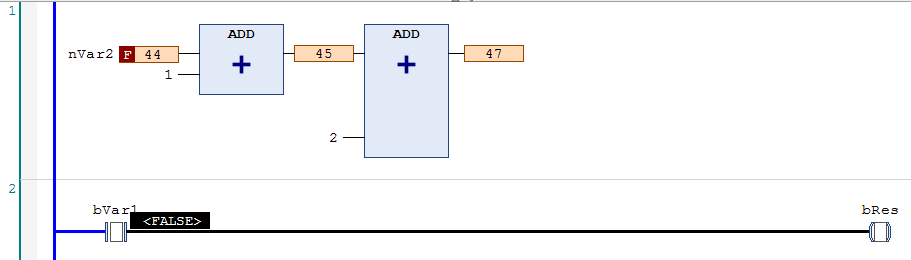
After forcing, the affected values are marked with the symbol - Network editors and CFC:
Connecting lines (signal lines) are color-coded according to their Boolean actual value: blue means TRUE, black means FALSE. - LD editor:
In addition, the contact and coil elements are marked. For contacts or coils, a prepared value (TRUE or FALSE) is displayed in a small window next to the element. - SFC editor:
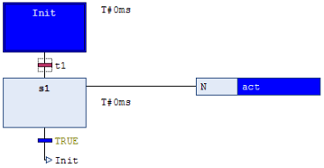
Transitions with value TRUE are color-coded according to their Boolean actual value: blue means TRUE, black means FALSE.
Active steps are marked in blue.
In the implementation forced transition values are marked red. - IL editor:
Current values are displayed in a separate column
Monitoring in the ST editor:
Monitoring in the LD editor:
Monitoring in the SFC editor:
 | You can deactivate the inline monitoring function here: Menu Tools > Options, Category TwinCAT > PLC Environment > Text editor, Tab Monitoring. |
See also:
- Reference Programming: ST editor in online mode
- Reference programming: FBD/LD/IL editor in online mode
- Reference programming: SFC editor in online mode
- Reference programming: CFC editor in online mode
Partially monitor array
An array that is expanded shows the actual values for up to 1000 elements. This can be confusing. Moreover, an array can contain more than 1000 elements. Then it is helpful to limit the range of displayed elements. You can do this during online operation in the following ways.
- You have loaded a project on the controller in which a multi-dimensional array variable with more than 1000 elements is declared.
Sample:aSample :ARRAY [1..100, 1..10, 1..20] OF INT;
- 1. For the variable
aSample, click in the field of the column Data type. - The Monitoring area dialog opens.
- 2. Enter the value [1, 0, 0] at Start.
- 3. Enter the value [1, 10, 20] at End.
- The actual values of 200 array elements are displayed. The range is limited to elements of index [1, <i>, <j>].
Monitoring a function block
If you are about to open an editor view for a function block in online mode, you will be asked whether you wish to open the view of the basic implementation or an instance of the function block. Monitoring is only possible in the basic implementation if a breakpoint is set. If you set a breakpoint in the basic implementation, it will be set in all instances. The values of the instance that is executed first in the program sequence are displayed first in the basic implementation view.
If you double-click on the editor view of a function block during online operation, a dialog appears in which you can choose between the view of the basic implementation or a specific instance.
If you select the basic implementation, then the code appears in the editor without displaying current values. Now set a breakpoint in the basic implementation. If the execution stops there, the current values of that instance are displayed which is processed first in the program flow. You can now step successively through all instances.
If you select one of the instances, then the editor with the code of the function block instance opens. The current values are displayed and constantly updated in the declaration and, if necessary, in the implementation.
See also:
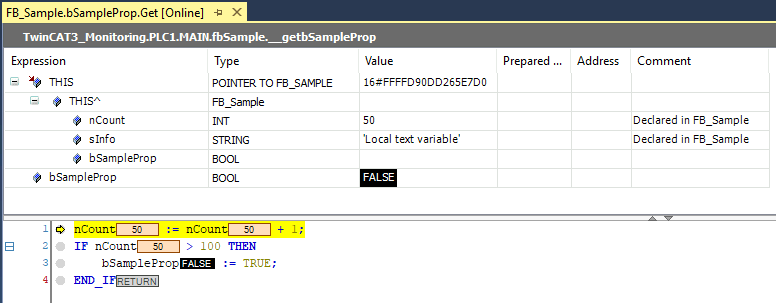
Monitoring the property
You can monitor variables in a property object  when you set a breakpoint during online operation. When stopped there, the current values are displayed.
In addition to its own values, the values of the variables of the higher-level instance are automatically displayed. In the declaration part of the property, the pointer THIS appears in the first line, pointing to the higher-level instance, with the data type specifications and current values.
See also:
Monitoring the property access in the higher-level programming object
You can monitor the values of lower-level properties in a function block or program in addition to the variable values.
To do this, insert either the pragma {attribute 'monitoring' = 'variable'} or the pragma {attribute 'monitoring' = 'call'} to the lower-level property object in the declaration. If you open the higher-level program or the higher-level function block instance at runtime, then the current property values are displayed in the editor in addition to the current variable values.
See also:
- Reference programming: Pragmas > 'monitoring' attribute
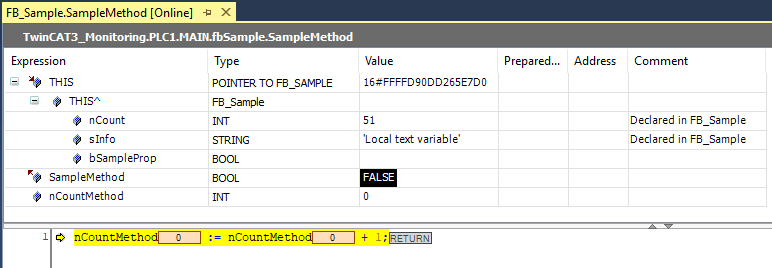
Monitoring the method
You can monitor variables in a method object  if you set a breakpoint in the method during online operation. When stopped there, the current values are displayed.
In addition to its own values, the values of the variables of the higher-level instance are automatically displayed. In the declaration part of the method, the pointer THIS appears in the first line for this purpose, which points to the higher-level instance, with the data type specifications and current values.
See also:
Monitoring the function
You can monitor variables in a function object if you set a breakpoint in the function during online operation. When stopped there, the current values are displayed.
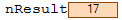
Monitoring the return value of a function call
In the ST editor, the current return value of a function is displayed in the inline monitoring instead of a POU at which the function is called if the following is satisfied:
- it is a value that can be interpreted as a 4-byte numerical value (e.g. INT, SINT or LINT).
- the pragma {attribute 'monitoring' := 'call'} is inserted in the function declaration.
See also:
- Reference Programming: Pragmas > Attribute 'monitoring'