Sample implementation of an NTC sensor
The procedure below illustrates the implementation of an NTC sensor whose characteristic curve is not already stored in the EL3204-0200 terminal based on three methods, i.e. RTD table, B-parameter equation and Steinhart-Hart equation.
An NTC030WP00 sensor is used in the example.
In this case the manufacturer provides a table with temperature and corresponding resistance values and the following sensor characteristics: NTC 10 kΩ +/- 1% at 25°C, Beta 3435.
Example for the implementation of an NTC sensor with the RTD lookup table
The general procedure is described in chapter Lookup table. This example illustrates some special cases. An example XML file (Download: ZIP) for the NTC030WP00 sensor is available for download.
Description | Problem | Approach | ||
|---|---|---|---|---|
The table covers the temperature range -50°C...110°C, in 1°C steps | Total number of interpolation points 160. |
| ||
Resistance values in the temperature range -50°C... -44°C are between 330 kΩ... 240 kΩ | Measured values at low temperatures exceed the total measuring range of 240 kΩ |
| ||
The range of -40°C... 110°C should be mapped in 2°C steps. | Errors occur with default settings of the conversion factor 10: measuring range was not observed. Adjust the unit of the resistance values to the conversion factor | Comply with the measuring range. For the range 0... 240 kΩ, a conversion factor of 100 should be entered in 0x8001:04. The resistance values should then be specified in 1/10 Ω. The ranges are defined as follows: | ||
0x8001:01 Distance in Degrees | 2 | |||
0x8001:02 Amount of Entries | 75 | Conversion Factor 0x8001:04 | Measuring range | |
0x8001:03 Start Temperature | -40 | 1 | 0.. 6,533.5 Ω | |
0x8001:04 Conversion Factor | 10 | 10 | 0..65,535.0 Ω | |
0x8001:05 Value 1 | 188500 | 100 | 0..240,000.0 Ω | |
Example of NTC sensor implementation with B-parameter equation
The B-parameter (Beta 3435) and the parameters Rn (10 kΩ) and Tn (25°C) can be taken from the manufacturer's data and entered directly in the CoE directory 0x8002.
CoE Entry | Entry |
|---|---|
0x8002:01 Min Temperature | -40 |
0x8002:02 Max Temperature | 110 |
0x8002:03 Rn | 10000 |
0x8002:04 Tn | 25 |
0x8002:05 B-Parameter | 3435 |
If one compares the implementation of the table and the B-parameter equation, as shown in the diagram below, it becomes clear that the B-parameter equation is only valid in a limited range (large deviations at low temperatures). If the whole temperature range is required, it is preferable to use the Steinhart-Hart equation for the implementation.
Example for the implementation of an NTC sensor with Steinhart-Hart equation
The Steinhart-Hart parameters can be calculated based on the sample file. The required resistance values at three defined temperatures (e.g. 0°C, 25°C and 85°C) can be taken from the manufacturer's table or measured directly at the sensor.
CoE Entry | Entry |
|---|---|
0x8004:01 Min Temperature | -40 |
0x8004:02 Max Temperature | 110 |
0x8004:03 C1 | 8.8424E-4 |
0x8004:04 C2 | 2.5202E-4 |
0x8002:04 C3 | 0 |
0x8002:04 C4 | 1.9018E-7 |
Comparison of the implementation via Steinhart-Hart and B-parameter equation
The diagram shows that the implementation via the Steinhart-Hart equation gains values closer to those from the manufacturer's table than the implementation via the B-parameter equation. If a manufacturer's table is available, this method is always preferable.
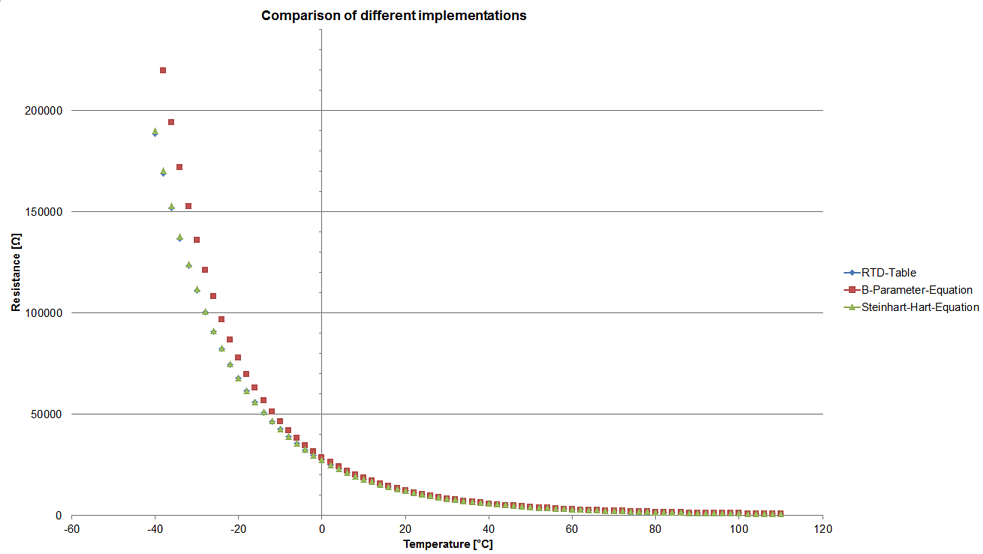 Fig.175: Comparison of implementation via B-parameters and Steinhart-Hart parameters