Data stream and correction calculation
The flow chart below (Fig. EL30xx data stream) illustrates the data stream for the EL30xx (processing of raw data, and verification and correction of the process data when the limits are reached).
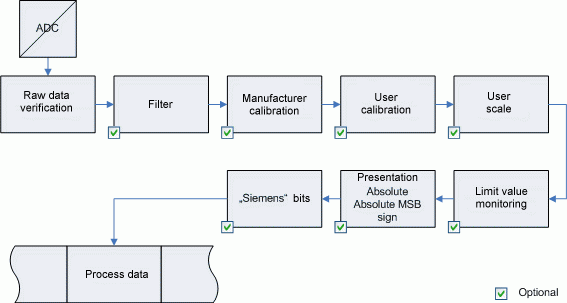 Fig.221: EL30xx data stream
The correction calculation for the raw values in relation to the output values when the limit ranges are exceeded is shown in figures:
Data flow with correction calculation - EL300x
Data flow with correction calculation - EL301x, EL304x
Data flow with correction calculation - EL302x, EL305x
Data flow with correction calculation - EL306x
EL300x
+/- 10 V
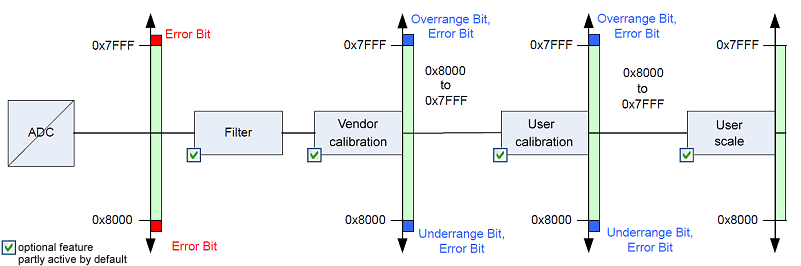 Fig.222: Data flow with correction calculation - EL300x
EL301x, EL304x
0...20 mA
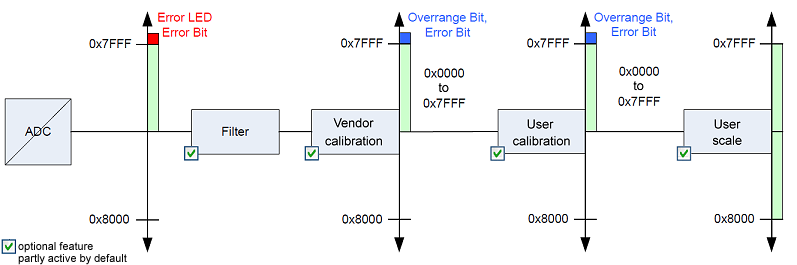 Fig.223: Data flow with correction calculation - EL301x, EL304x
EL302x, EL305x
4...20 mA
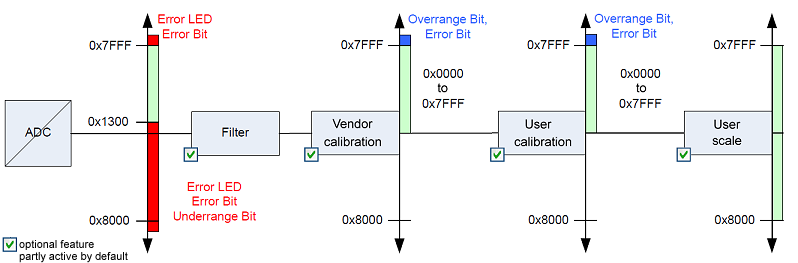 Fig.224: Data flow with correction calculation - EL302x, EL305x
EL306x
0...10 V/0...30 V
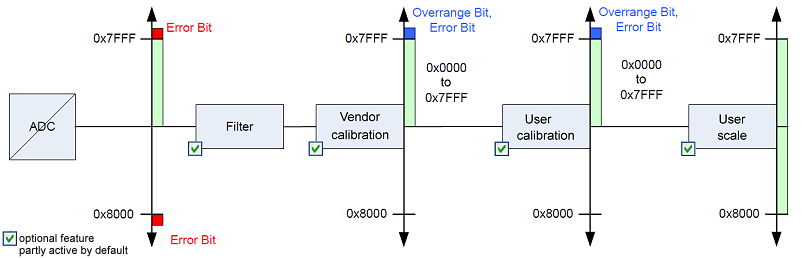 Fig.225: Data flow with correction calculation - EL306x
Further Information