History
Here, consumption is shown based on calculated data. For correct calculation, it is essential that all lamps have been set up accordingly and have the correct rated power (see Lamps and Lamp templates).
The data is displayed in various forms.
Day comparison:
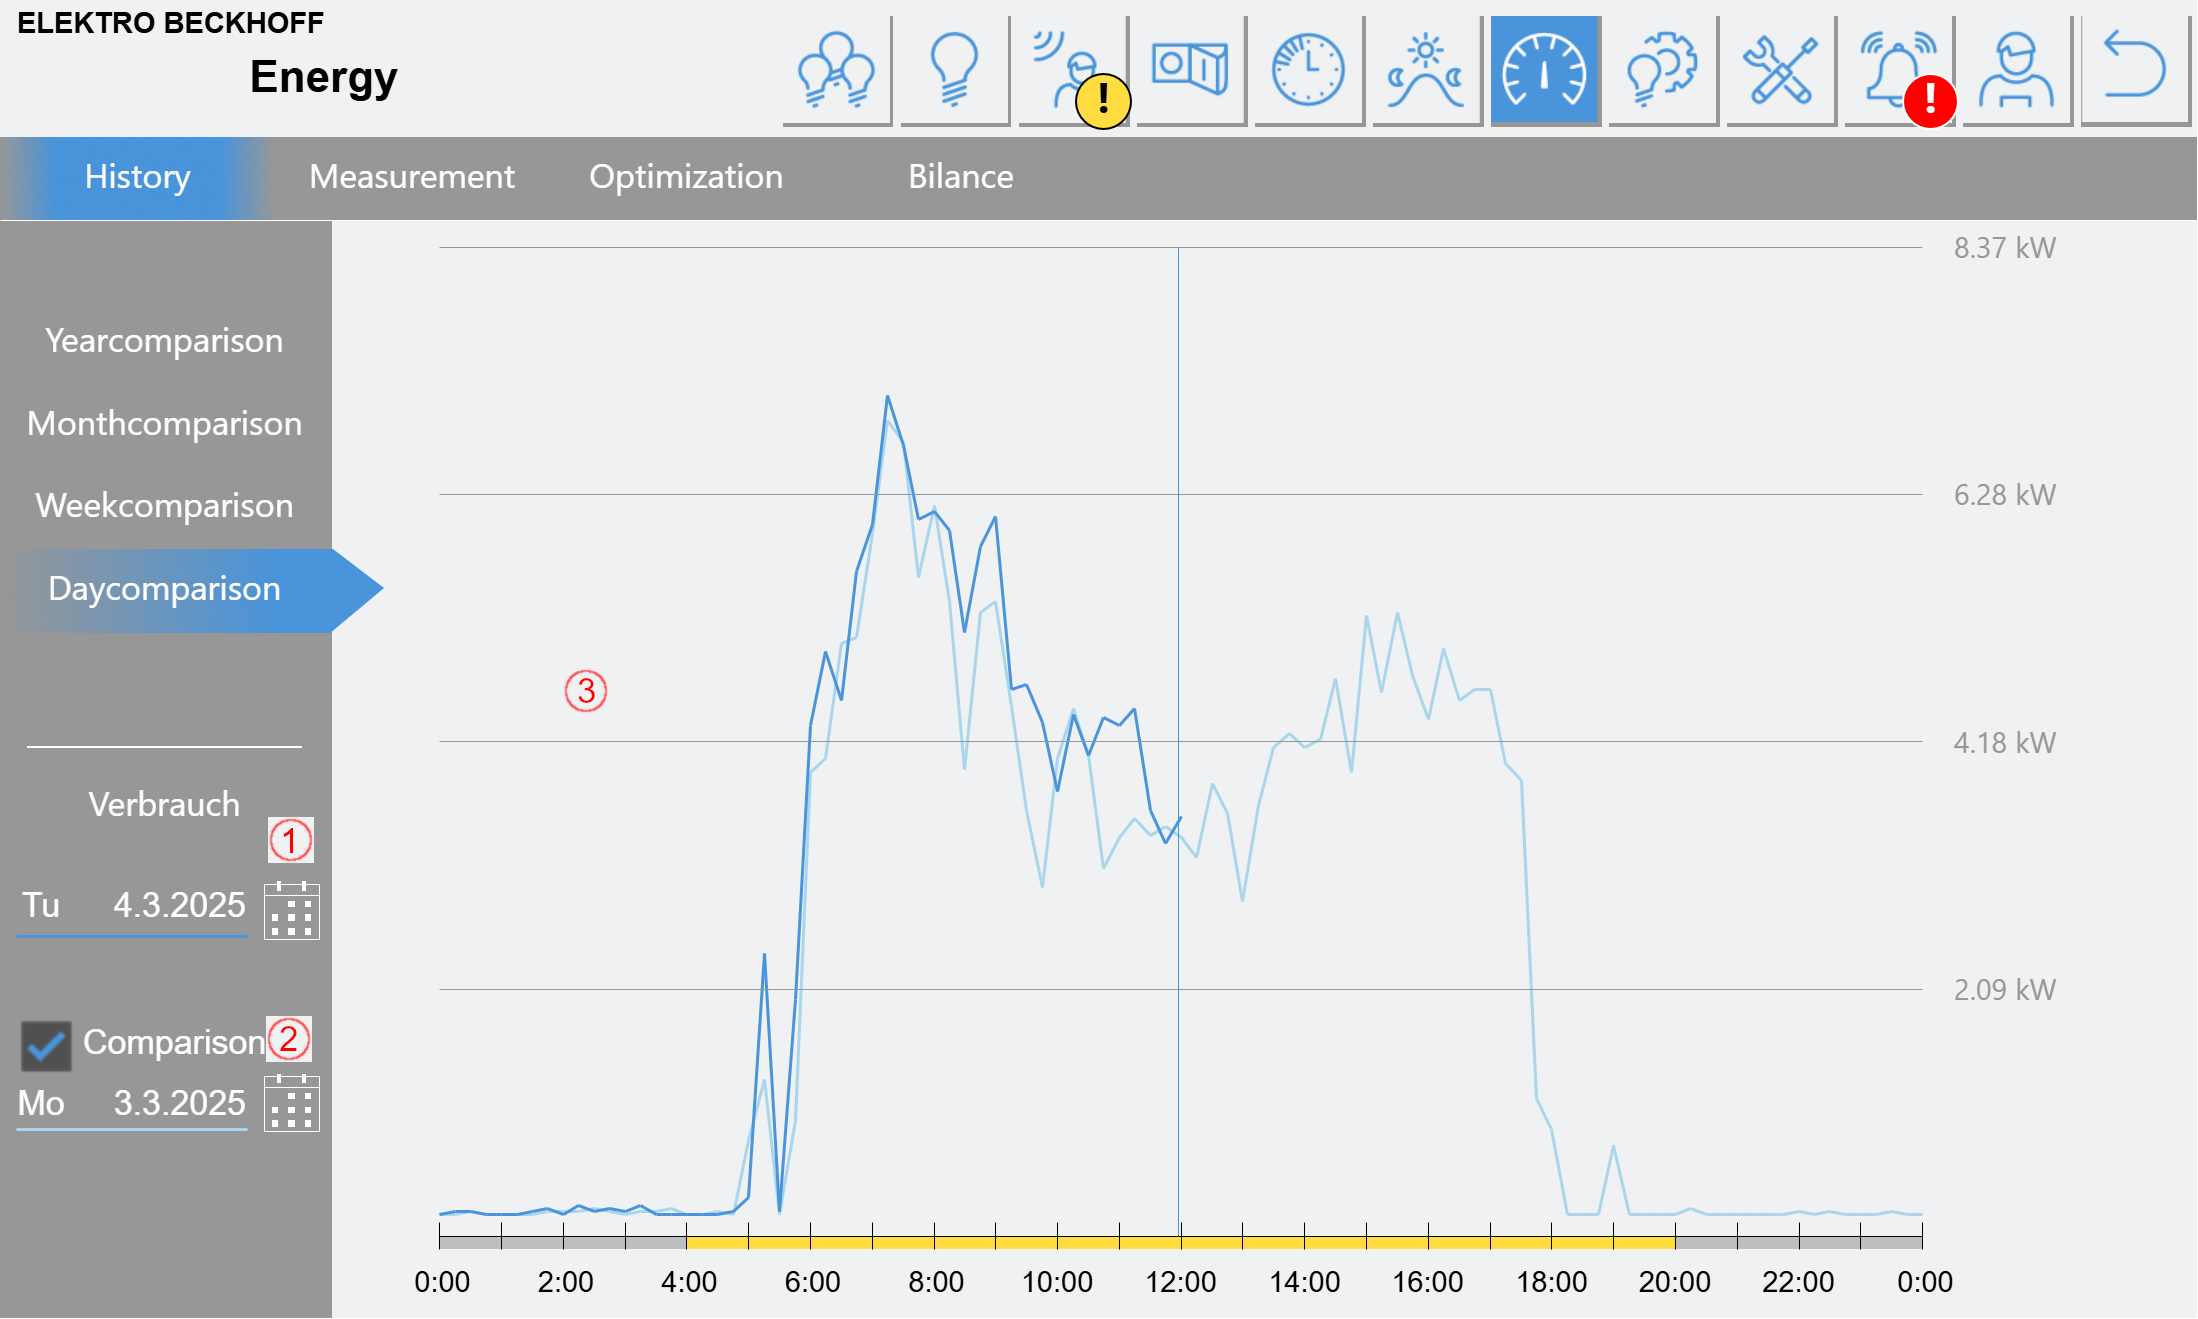
Shows the course of a selected day. A second day can be displayed in parallel as a comparison.
(1) The displayed day can be selected here using the calendar.
(2) If Comparison is activated, a second day can be selected here using the calendar.
(3) Daily course of total consumption in quarter-hourly values
Week comparison:
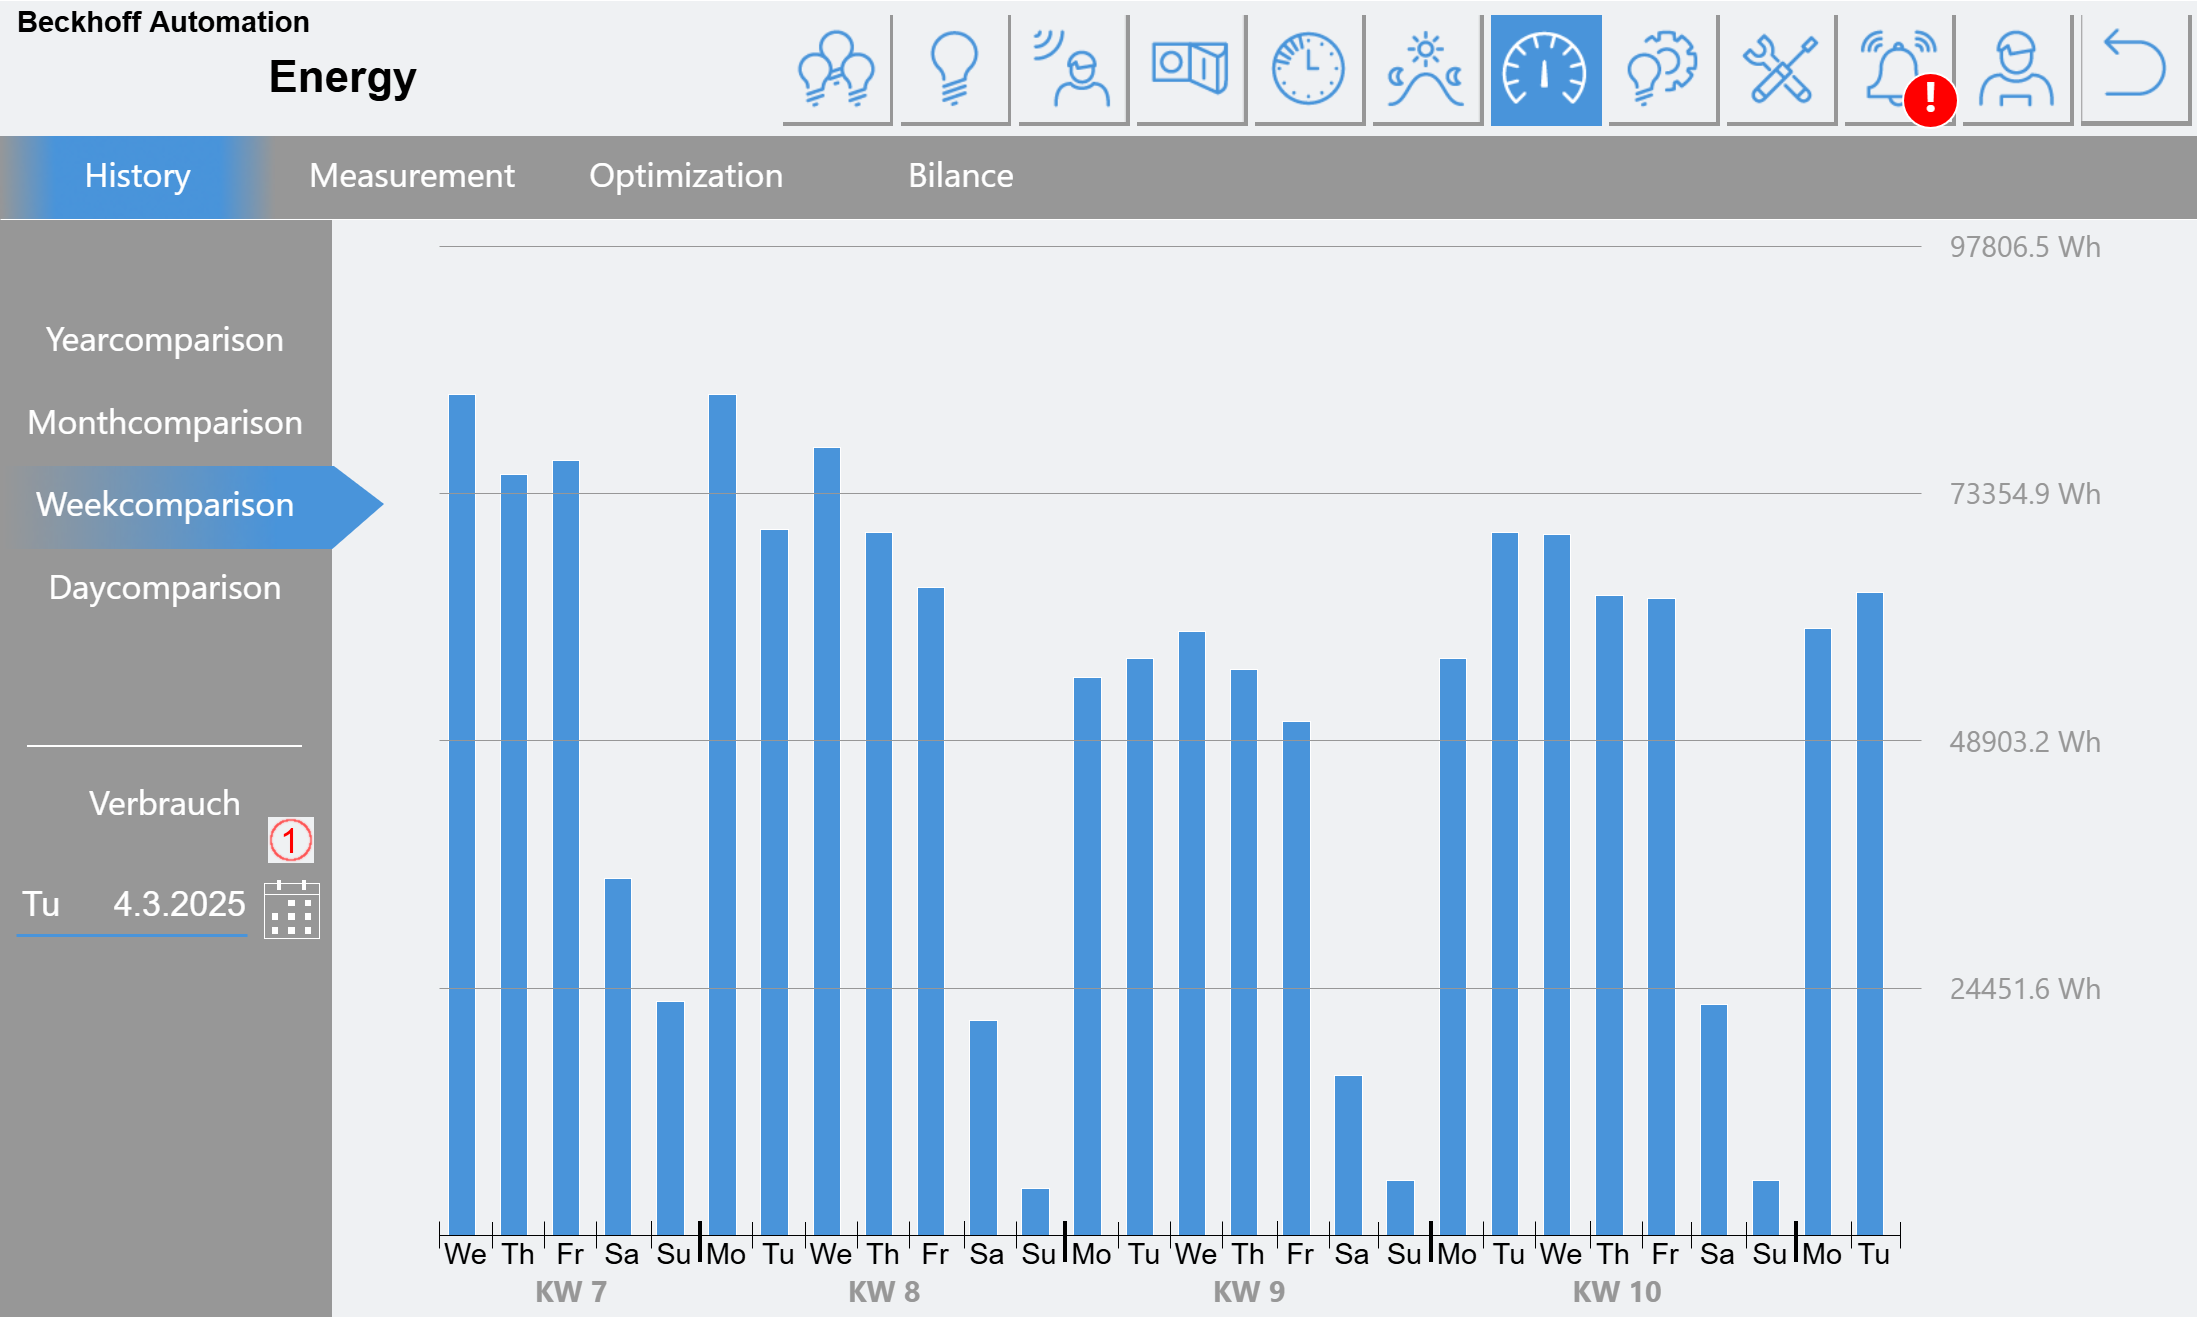
Displays the total consumption of individual consecutive days. 28 days are displayed.
(1) A day can be selected using the calendar. The selected day is displayed on the far right of the diagram. Accordingly, the previous 27 days are displayed from right to left.
Month comparison:
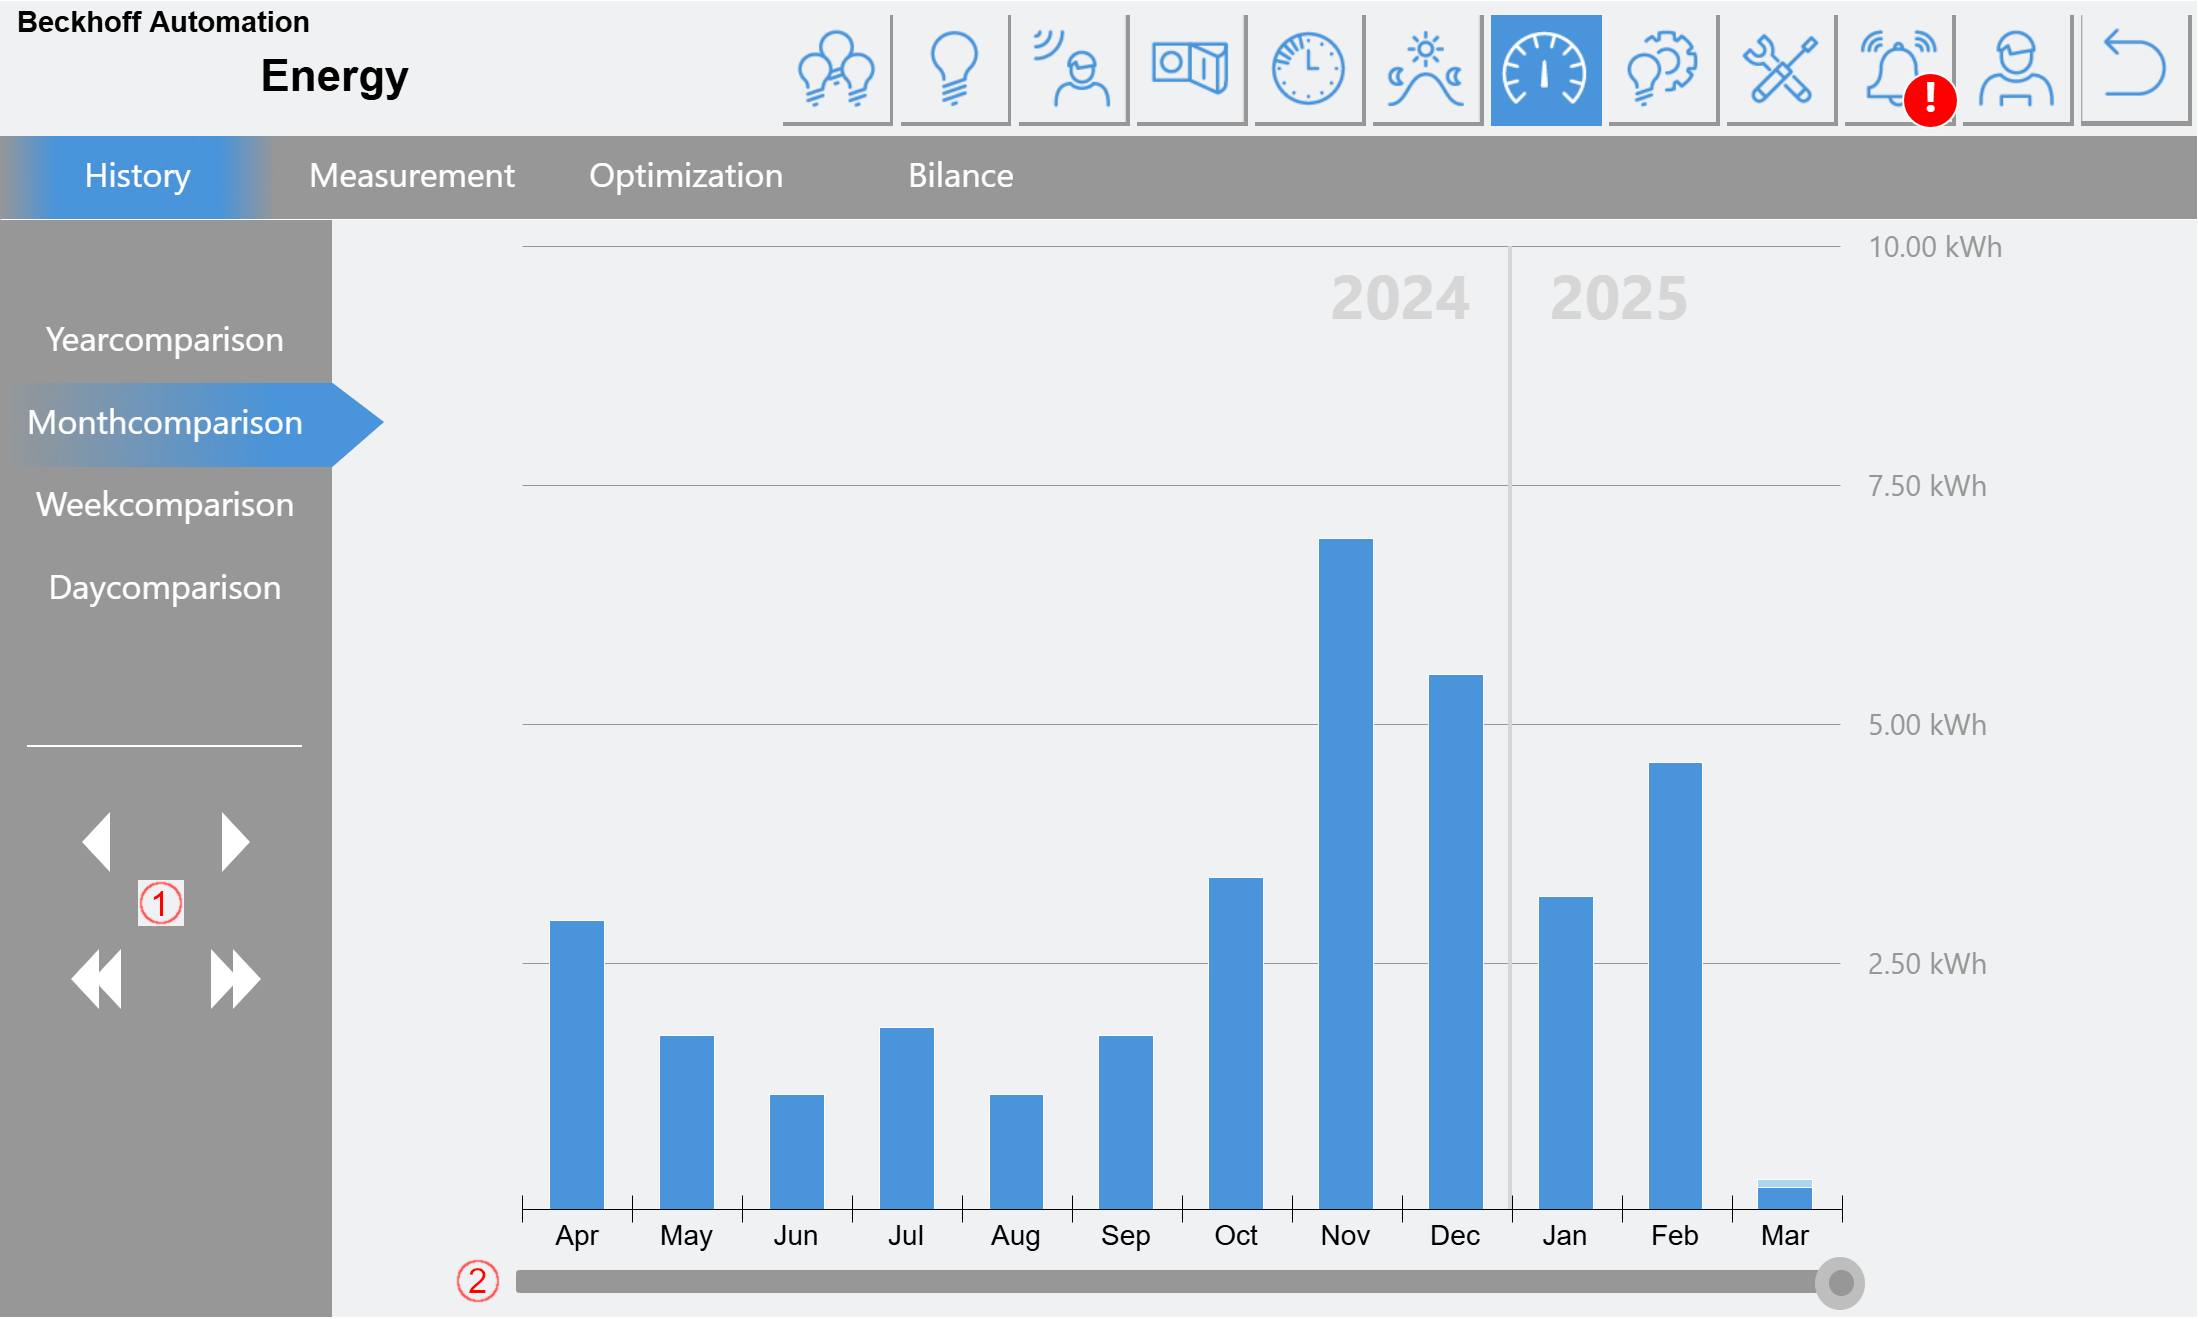
The total consumption of the past months is shown here.
(1) Use the arrow buttons to jump forwards or backwards in the time period. The single arrow jumps 2 months, the double arrow jumps 1 year
(2) As in (1), the slider can be used to change the displayed time period
Year comparison:
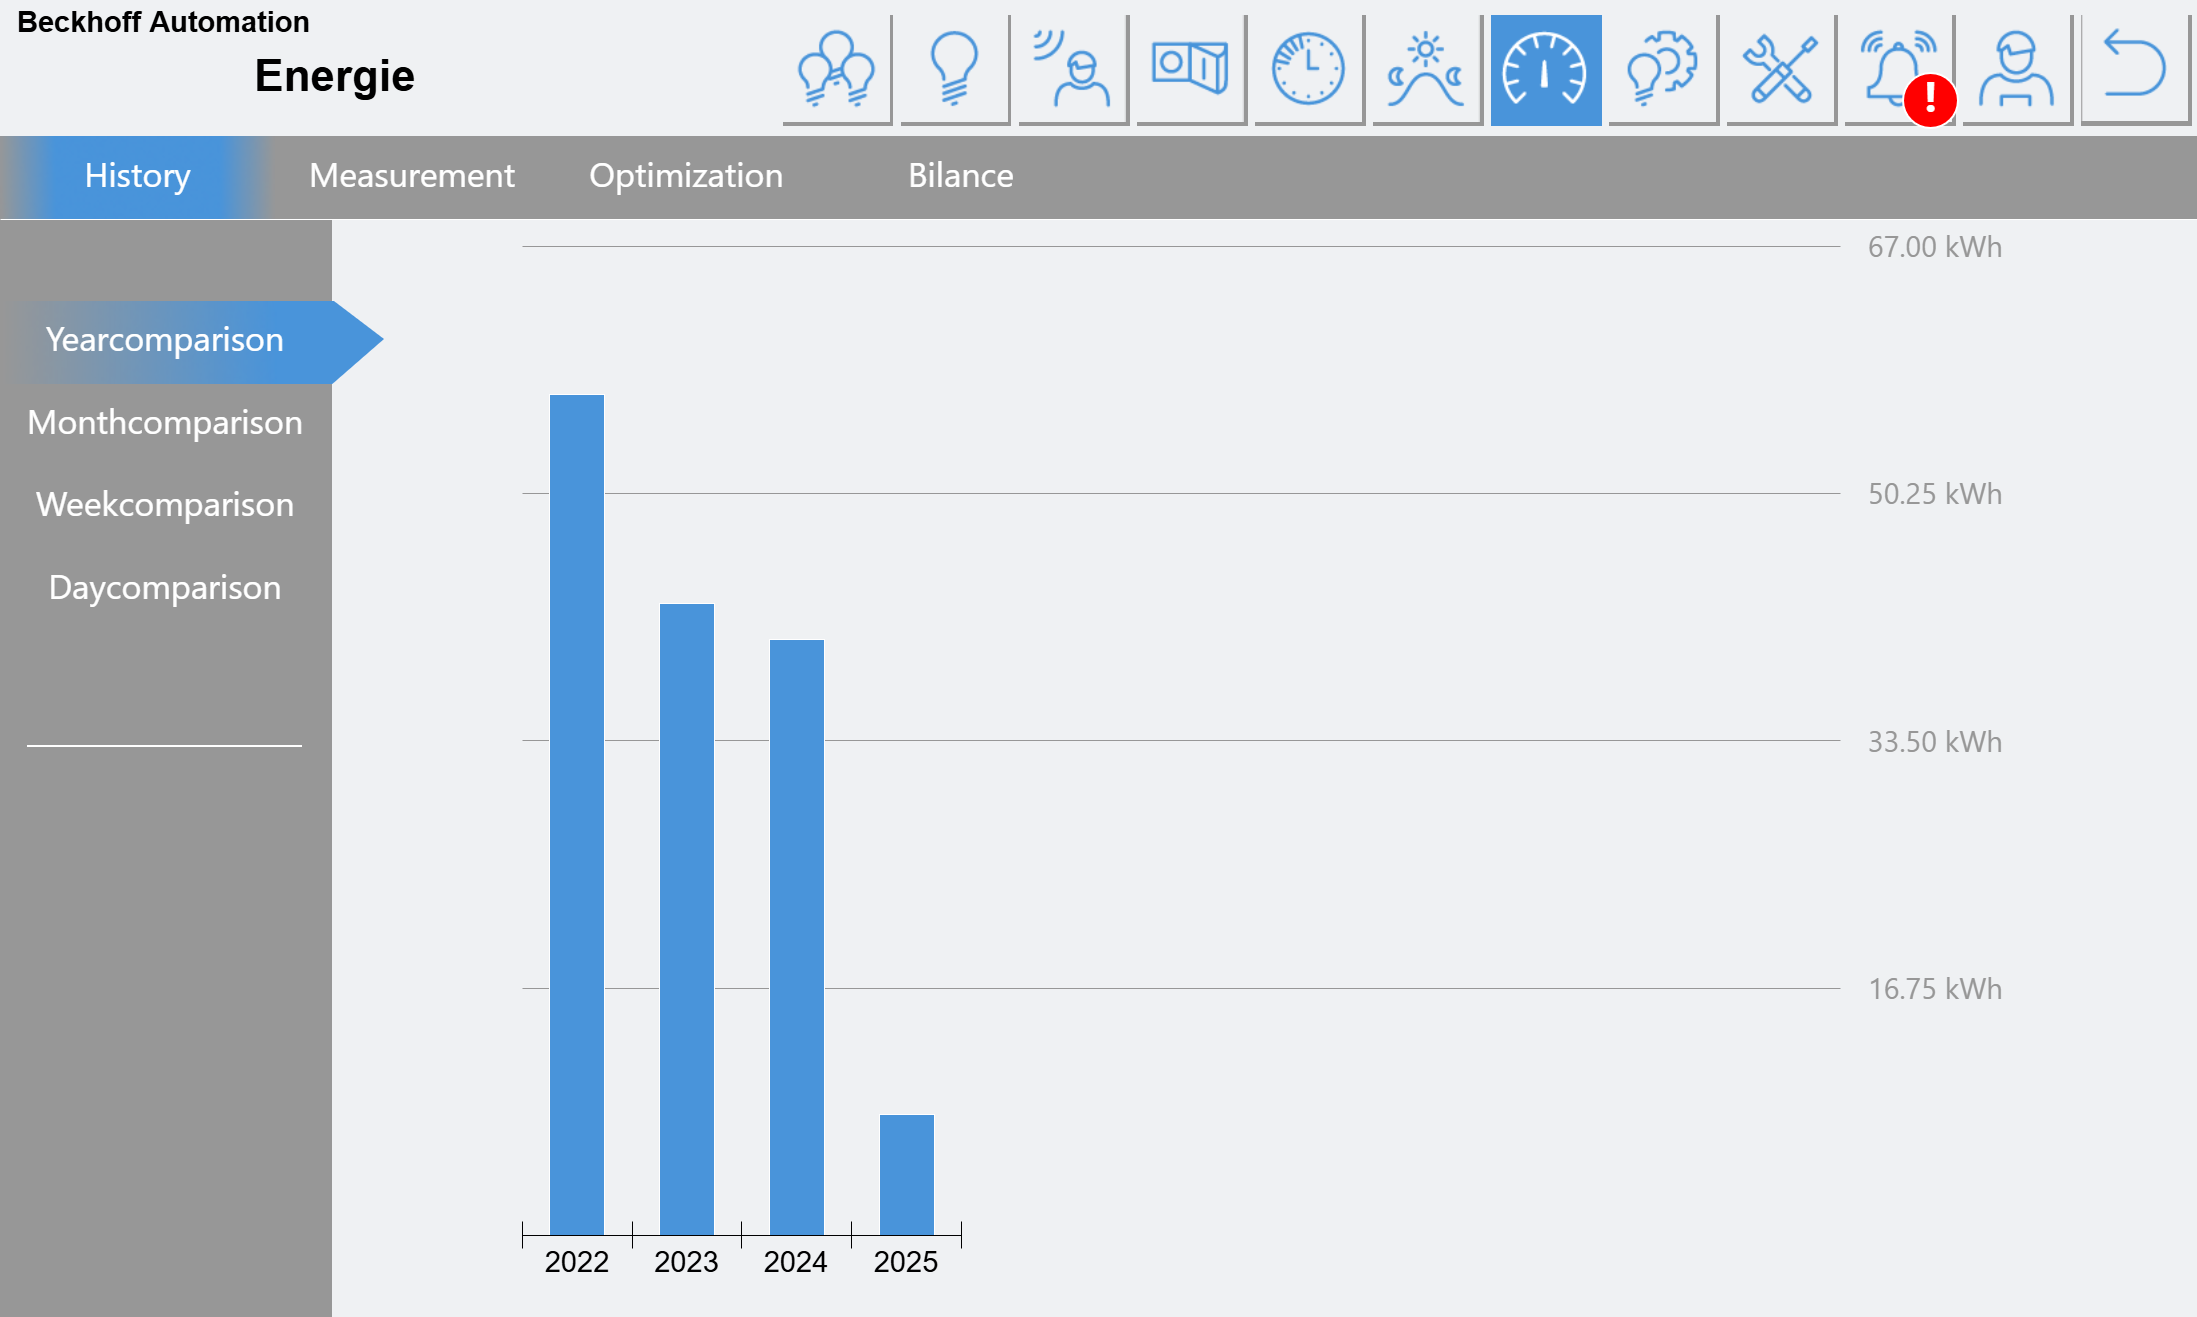
The total consumption for up to 12 years is shown here