Fatigue Analysis
This sample explains the functional mode and application possibilities of the function blocks FB_CMA_RainflowCounting FB_CMA_MeanStressCorrection and FB_CMA_MinersRule for estimating the fatigue process of monitored components.
For the calculation of the Wöhler curve, the function F_CM_CalculateWoehlerCurve is executed on the basis of fictitious material parameters.
Further explanations can be found under the item Application concepts in the section Fatigue life analysis and damage calculation.
The source code for this sample can be downloaded here: FatigueAnalysis_Sample.zip
Block diagram
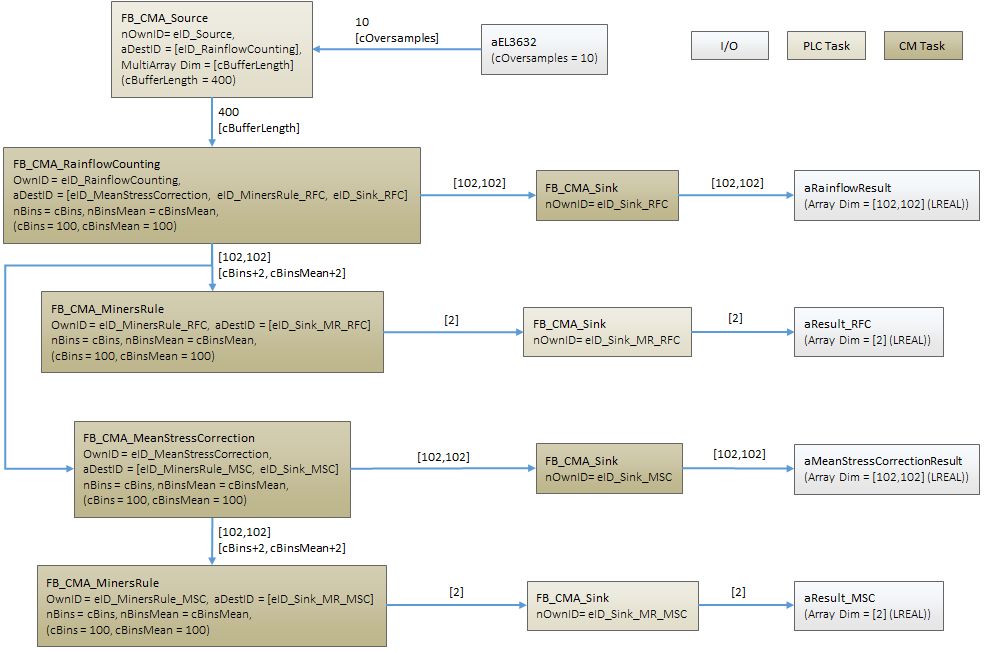
Program parameters
The table below shows a list with the important parameters (GVL_Constants) for the configuration of the function blocks.
First, the expected measuring range for mechanical stresses is defined by cStressMin and cStressMax. It is important that all stresses occurring during monitoring lie within this interval. The resolution with which the stress ranges of the stress cycles are then counted is defined by cRfRangeBins and cRfMeanBins. By default, a minimum of 64 x 64 would be set here, usually 128 x 128. Further constants for parameterizing the function blocks are then defined from these four values.
In the sample code, the influence of mean stress correction is taken into account and can be compared with the calculation without mean stress correction in the TwinCAT Scope. The sample uses the correction according to Goodman, but can be switched to the correction according to Gerber or disabled via cMSCType.
Furthermore, material parameters are specified for the definition of the material-specific Wöhler curve used. The parameters used here are fictitious and selected in such a way that a visual effect can be observed in the TwinCAT Scope after a short time.
| -50 MPa | Minimum occurring stress |
| 50 MPa | Maximum occurring stress |
| 100 | Number of bins in the stress range axis |
| 100 | Number of bins in the mean stress axis |
| eCM_Goodman | Mean stress correction type |
| 350 | Stress Range Intercept (stress intersection with cycle number 1) |
| 700 | Ultimate Tensile Strength |
| 3 | Slope of the Wöhler curve between N = 1 and cNC1 |
| 5 | Slope of the Wöhler curve starting from point cNC2 |
| 100 | Transition point for UTS correction |
| 100000 | Fatigue Transition Point |
Explanations
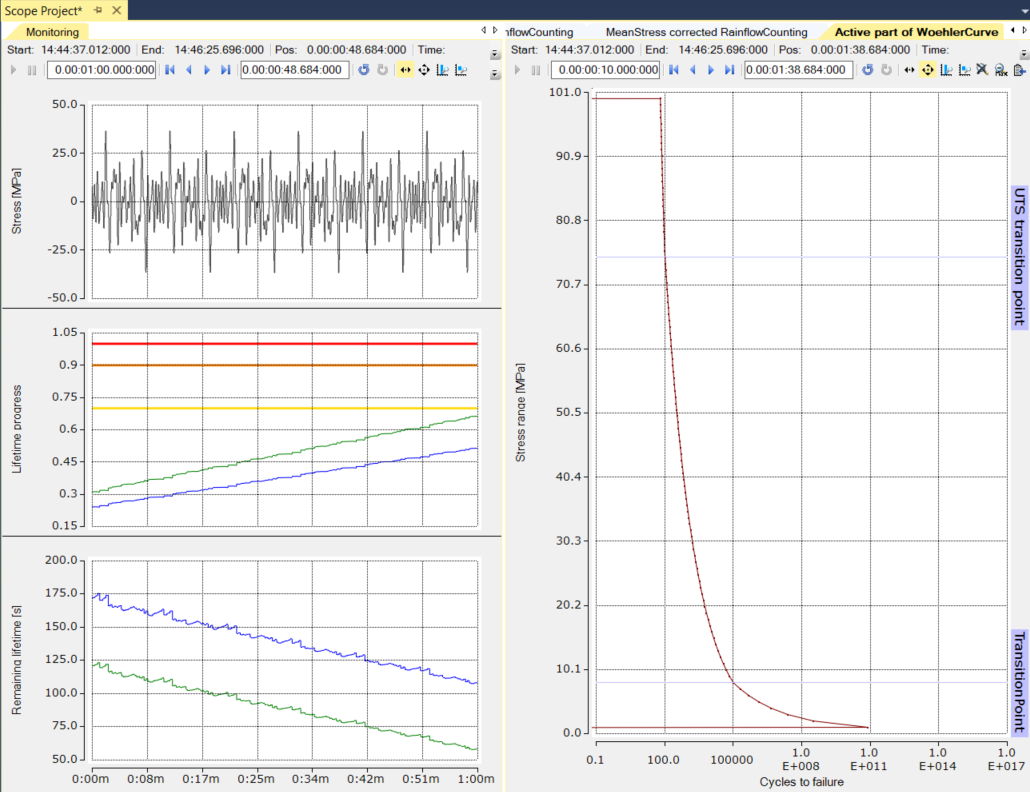
After activating the TwinCAT configuration and starting the TwinCAT Scope, several representations can be seen.
At the bottom on the right-hand side you can see a static graphic, which represents the Wöhler curve. This representation takes place from the parameterization in the GVL_Constant.
The synthetically generated stress signal is plotted over time in black on the left side. In this example, the stress is always given in megapascals (MPa). In the graphic below that, the progress of the sum damage is displayed, where green stands for the damage sum with activated mean stress correction and blue for the damage sum with deactivated mean stress correction. The progress of the damage grows from zero, with one representing the maximum sum damage (point of computational component failure) using the material parameters provided. Accordingly, 3 horizontal lines are drawn at 70%, 90% and 100%, which could be used as warning and alarm thresholds. The bottom graph indicates the estimated remaining fatigue life in seconds. Accordingly, these two curves fall as the simulation continues.
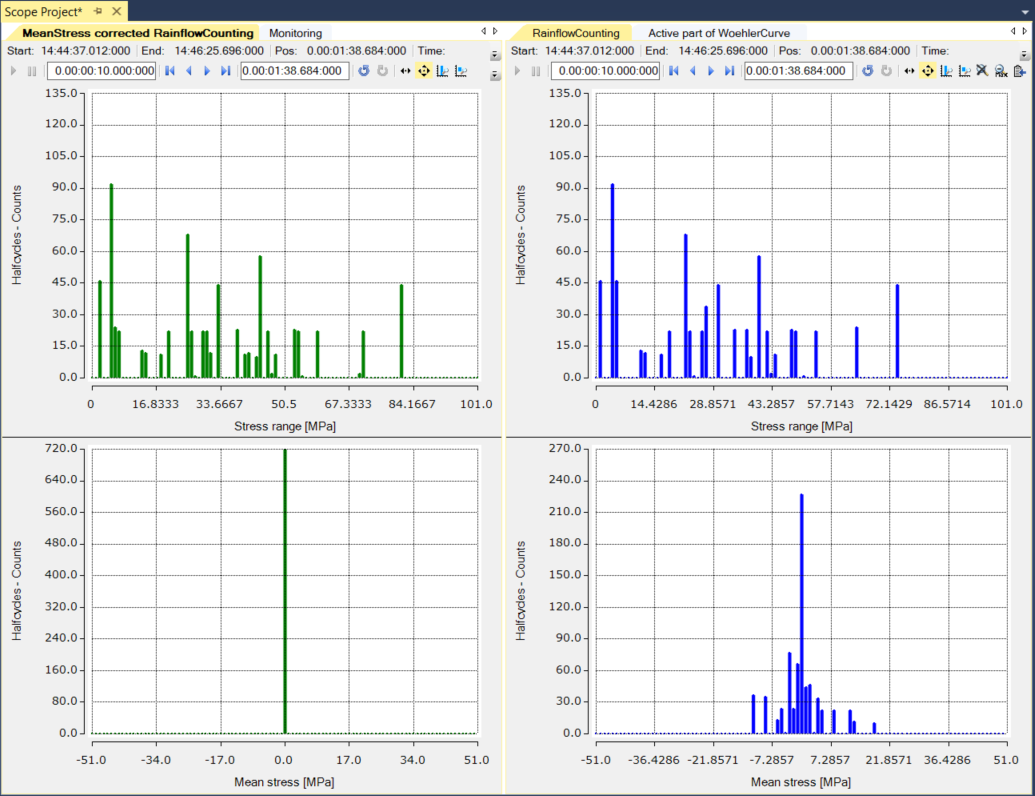
Likewise, the already counted half-cycles of the Rainflow Counting are shown in array bar charts, again in green with mean stress correction and in blue without mean stress correction. The higher damage caused by the correction of the stress ranges with activated mean stress correction can be clearly observed.
In the left part of the graphic you can see that the mean stress correction makes the mean stress axis obsolete (sets it to zero) and impinges on the stress range as a correction. For this reason, half-cycle counts on the left are offset slightly to the right on the stress range axis.
Requirements
Development environment | Target platform | PLC libraries to include |
|---|---|---|
TwinCAT v3.1.4022.25 | PC or CX (x86, x64) | Tc3_CM, Tc3_CM_Base |