Gearbox monitoring
Motivation
This section describes the concept of the monitoring of gearboxes. Like roller bearings, gearboxes are among the commonest machine elements. Since they are used in a wide range of drives, they usually play a key role for the reliable function of a system. Typical gearbox damage differs from damage in roller bearings. This is due on the one hand to the fact that in gearboxes highly stressed parts slide directly on top of one another, which places particular demands both on the lubrication and on the quality of the surface. Due to the forces resulting from normal operation that have to be absorbed, gearboxes are relatively large and thus expensive and a replacement may be necessary during the fatigue life of the machine even if maintenance has been performed correctly. Adequate lubrication and correct assembly are also important here. However, the damage patterns that occur are by no means exclusively attributable to errors in these points. Excessive voltages at the contact points or interaction between corrosion and overheating can lead to incipient surface damage (pitting, micropitting, spalling, wear) right up to chipping and deformation of the tooth surfaces. Mechanical shocks and overload can cause the direct breakage of gear wheels. Compared with roller bearings, gear unit defects tend to result in abrupt failure and significant consequential costs. This is due to the fact that in gearwheels the greatest tension is at the tooth base – see diagram below (red surfaces). Consequently, fatigue symptoms occur at an early stage there, which lead in the course of the time to deep cracks and ultimately to the breaking off of teeth. The latter leads in extreme cases to the whole gearbox blocking apparently without preliminary warning and causing extensive consequential damage, for example due to the breakage of axles. The causes just mentioned and the consequential behavior give rise to two objectives for the monitoring of gearboxes:
- Firstly, it is of interest to monitor symptoms of wear on a long-term basis and to recognize problems at an early stage through trend observations and to rectify them promptly, before damage occurs.
- Secondly, acute damage can be recognized immediately by monitoring, whereby repair measures can be initiated earlier and failures and downtime can be reduced.
Theory
The theoretical background of the early detection for gearbox damage is briefly outlined below.
Meshing oscillations
In a gearbox the gear wheels roll off one another, in the course of which the individual teeth periodically come into contact, transfer force and then separate from each another again. While it is possible for this to take place with a precisely constant transmission ratio and largely constant force in a new, well-designed gearbox (involute toothing), it is not feasible for this roll-off to take place without a portion of sliding movement. As the above picture shows, a predominantly rotary motion takes place in the center of the tooth surface, with a growing portion of sliding movement as the distance from the center increases. In addition, the speed ratio is largely constant with such toothing, but the transmitted torque varies. Since the teeth are made of hard, elastic material and therefore deform slightly, they are excited to oscillate with the period of the meshing – the so-called meshing frequency.
Harmonics of the meshing frequency
Since the meshing oscillation is a forced oscillation that does not have a sinusoidal appearance, but is based on the comparatively sudden occurrence and abatement of the forces, it consists in the spectrum of numerous harmonics whose frequencies are integer multiples of the meshing frequency. The oscillations depend on the load on the gear wheel, since the torque deforms the teeth elastically. Gear wheel oscillations are thus load-dependent.
Consequences of wear
With increasing wear the tooth profiles deviate more and more from the ideal shape, since material is removed by the sliding of the surfaces over one another. This happens more and more intensively the further away the surface is from the center of the tooth flank, as the diagram above shows. The sliding motion itself therefore increases and the torque varies more strongly, whereby the meshing oscillations and in particularly the harmonics they contain are amplified. The analysis of the harmonics is thus the key to the evaluation of the condition of the gearbox. Note that the sudden reduction in the harmonics in an already clearly damaged gearbox must be taken as an alarm signal: The breakage of a tooth flank may be so advanced that the elasticity of the toothing has increased. In this case the total failure of the gearbox can be expected soon.
The cepstrum
The cepstrum is the most important tool for the analysis of gearbox oscillations as well as harmonics and modulations. This is an operation that highlights periodicities in the signal spectrum.
The power cepstrum for a signal x(t) is defined as:

Interpretation
While a Fourier analysis indicates periodicities in the time range of a signal, the cepstrum indicates periodicities in the frequency range. An inverse Fourier transformation maps the result back into the time domain. However, the associated value index does not represent the original time axis relating to t, but the spectrum periods that have occurred. The parameter has the unit of time and is referred to quefrency, to indicate that it is a combination of inversion and inverse transformation. There are similar differentiating designations, for example, for entities and operations such as harmonic, filtering and phase analysis. The longer the length N of the two Fourier transforms employed is, the more input values are referred to for the calculation of the cepstrum, which reduces the influence of noise and (non-systematic) fluctuations. The time resolution can only be enlarged if the sampling rate is increased.
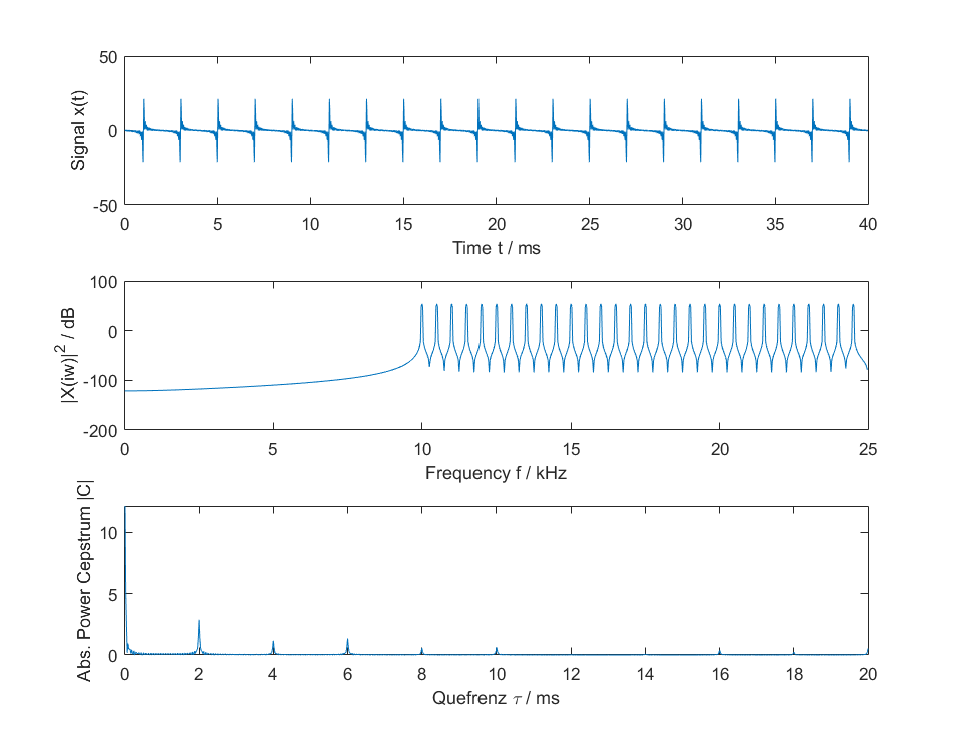
As an example, the following diagram shows the power spectrum and power cepstrum of a so-called harmonic sound complex. The time domain of the signal shows a repeated pulse every 2 ms. Each individual pulse is made up of superimposed harmonics, which means the situation is similar (coarse model) to the case of the gear unit damage described above. The diagram in the center shows the power spectrum. The periodicity of the power spectrum is clearly visible; the maxima are 0.5 kHz apart. The bottom diagram shows the magnitude the power cepstrum. The largest (global) maximum is at a quefrency of 0 ms, what has no relevance in practice (it merely shows the average value of the power spectrum). Apart from this maximum, the largest maximum can be seen at 2 ms, which precisely corresponds to the temporal repetition of the time signal or the reciprocal value of the distance of the local maxima in the power spectrum 1/0.5 kHz = 2 ms.
Processing concept (calculation steps)
Calculating the power cepstrum
The calculation of the cepstrum is based, as follows from the definition, on the "normal" frequency analysis. Accordingly, as described in section Analysis of data streams, initially the signal has to be split into sections, followed by multiplication with a window function, also referred to as "windowing". The power cepstrum is then calculated based on the calculation steps described about, i.e. Fourier transformation, absolute value calculation, logarithmic calculation and further Fourier transformation. It is important here to avoid exceeding value ranges because, similar to division by zero, the logarithm of zero is not defined.
The initial calculation result has a complex value. Typically, the magnitude or the square of the magnitude is used for the further analysis.
A sample is available for download from here: Power cepstrum
Calculation of quantiles
The short-term values of the cepstrum usually fluctuate quite strongly like those of the FFT from which they are derived. Therefore the next recommended processing step is the calculation of quantiles for each period obtained, i.e. each quefrency. For monitoring tasks, for example, the 95% quantile will often be determined. This is the value that will not be exceeded by the measured values in 95% of all cases. This calculation takes place as with the frequency analysis using the Quantiles function block.
Threshold value monitoring
Further processing depends on the specific objective:
- For trend analysis, it is useful to save the values obtained and to display their development over long periods.
- For automatic machine monitoring, a classification with configurable thresholds or limit values is useful. This is done by the DiscreteClassification function block sketched in here.
- For tasks such as machine protection with limited scope for individual analysis, the WatchUpperThreshold function block can be used, which automatically calculates the number of the highest limit category. If, for example, the state ‘Everything OK’ is assigned to category 0, the state ‘Warning’ to category 1 and the state ‘Alarm’ to category 2, then a warning can be sent by a text message when Level 1 is the output and the plant can be switched off automatically if Level 2 is the output.