Comparison of analysis results
Various analysis runs can be compared with the Analytics Diary. The Analytics Diary offers several advantages for exploratory data analysis and identifying an appropriate analysis method, including algorithm parameters.
- 1. By default, all analysis results including the project configuration are saved with each analysis run. You can change this setting at
Tools > Options > TwinCAT > Measurement > Analytics > Diary .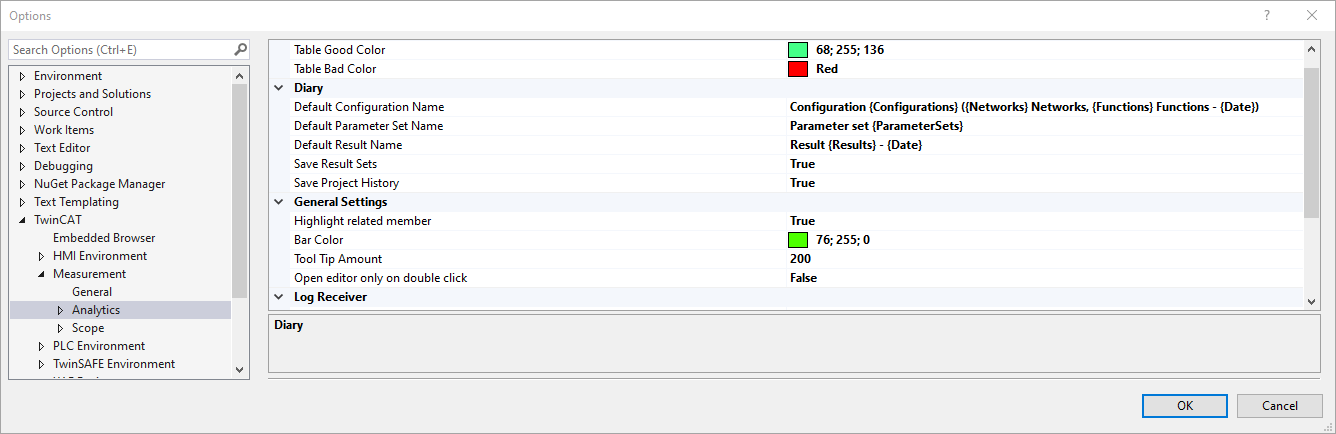
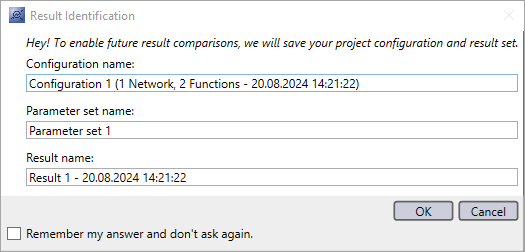
- 2. When you start an analysis, a Diary window appears. Here you can set the names of the configuration, the parameter set and the result. If nothing has changed in the project, only the data is saved. Likewise, no analysis configuration is generated if only the configuration of parameters changes (see also Global parameters).
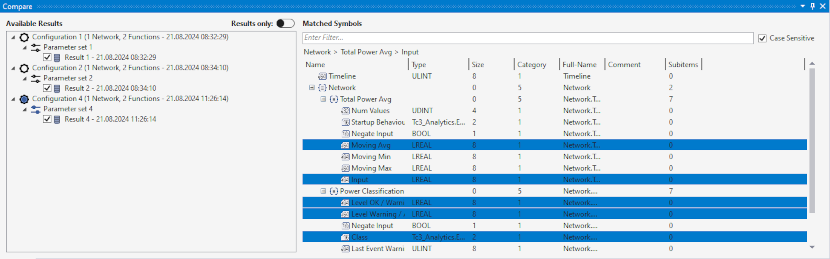
- 3. These entries will then appear in a tree structure in the Compare window, which you can open by clicking on them in the Solution Explorer. This shows the history of analysis runs. You can select multiple result data sets and matching symbols, which can then be viewed in the Table View and Chart View windows. The selection of data sets and symbols is therefore synchronized with the other two windows. The last data set is always selected by default.
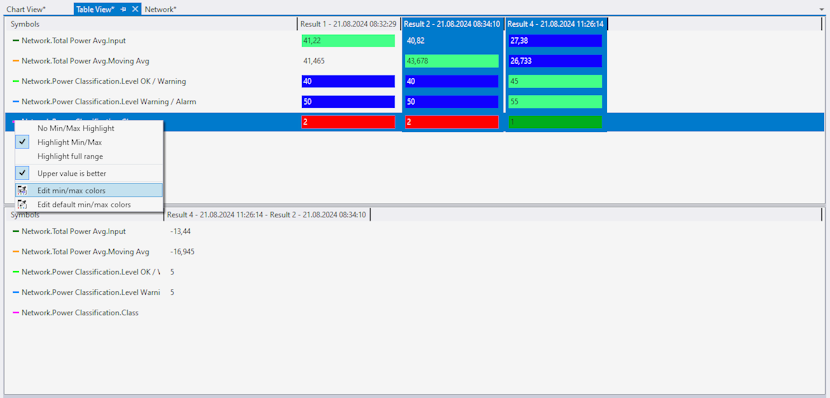
- 4. You can open the Table View and Chart View windows by clicking in the Solution Explorer. Two tables are displayed in the Table View. The first displays the last result of all selected data sets and symbols. The data sets are listed column by column and the symbols row by row. An optional color display can be used to visually highlight the differences between symbols. Furthermore, the differences between the symbols can be shown in a second table. At least two columns or data sets must be selected from the first table.
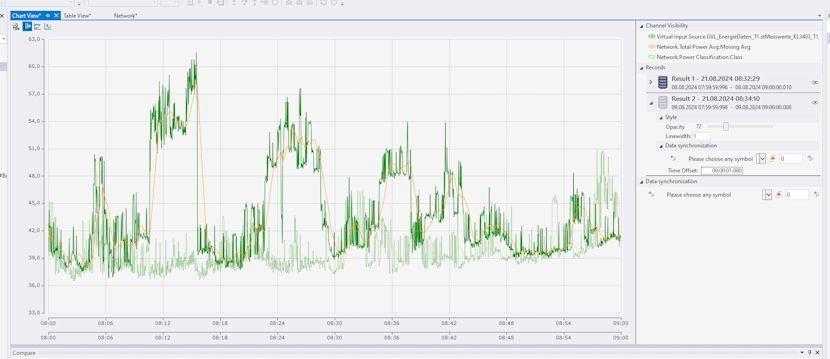
- 5. The Chart View is used to compare result data sets as time series. Different colors are assigned to the symbols. The symbols appear according to the number of selected data sets, whereby the opacity of the lines is reduced in each case. You can manually adjust the opacity and the line thickness to differentiate the data sets. To view a closer area, you can use a zoom equivalent to the scope.
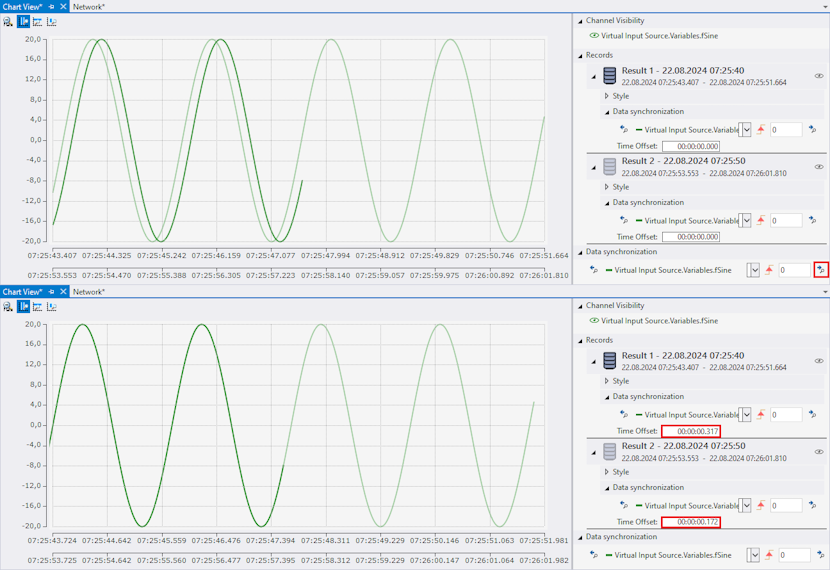
- 6. If the start times of the data sets do not match, you can adjust them for a direct comparison. This can be done either by manually entering the time offset or by an automatic edge search.
Further Information