Dialogs
Detailed view
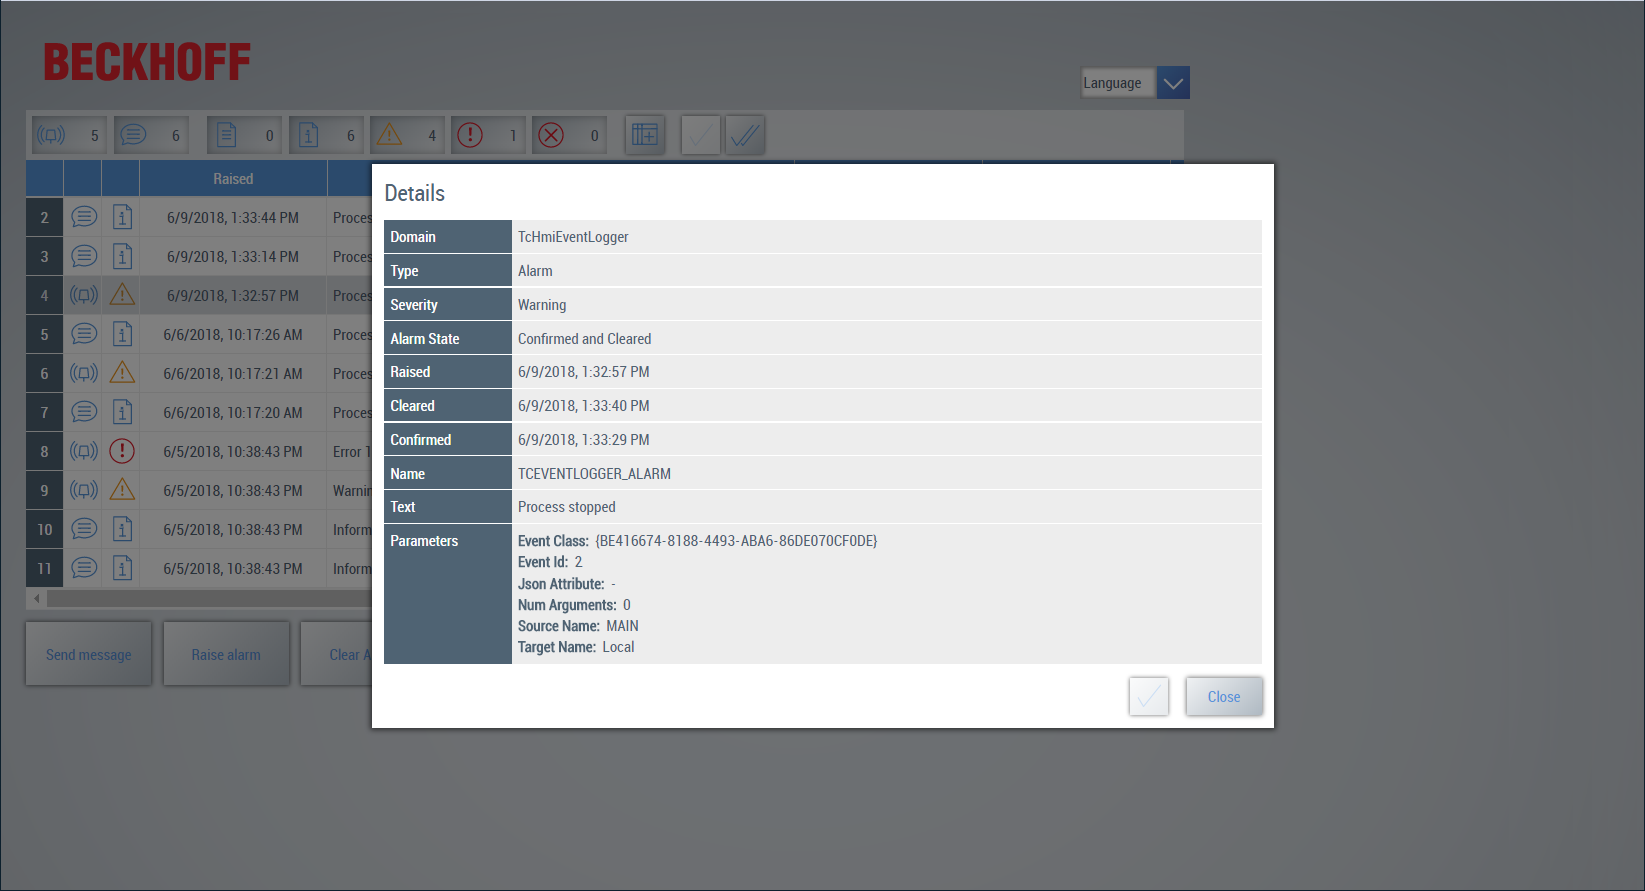
A detailed view can be called for each message and alarm in the Event Grid. The detailed view is opened by selecting a row in the Event Grid and double-clicking on the row. The detailed view provides additional information about the event.
Filter
Filters enable the display of alarms and messages according to certain criteria. It is possible, for example, to display only active alarms or to filter according to a certain time period. The filters can be configured under Filter in the control's properties window.
You can switch between different filters at runtime by calling a WriteToSymbol for the filter of the Event Grid. Alternatively, you can use various filter settings via the control's menu bar.
Columns
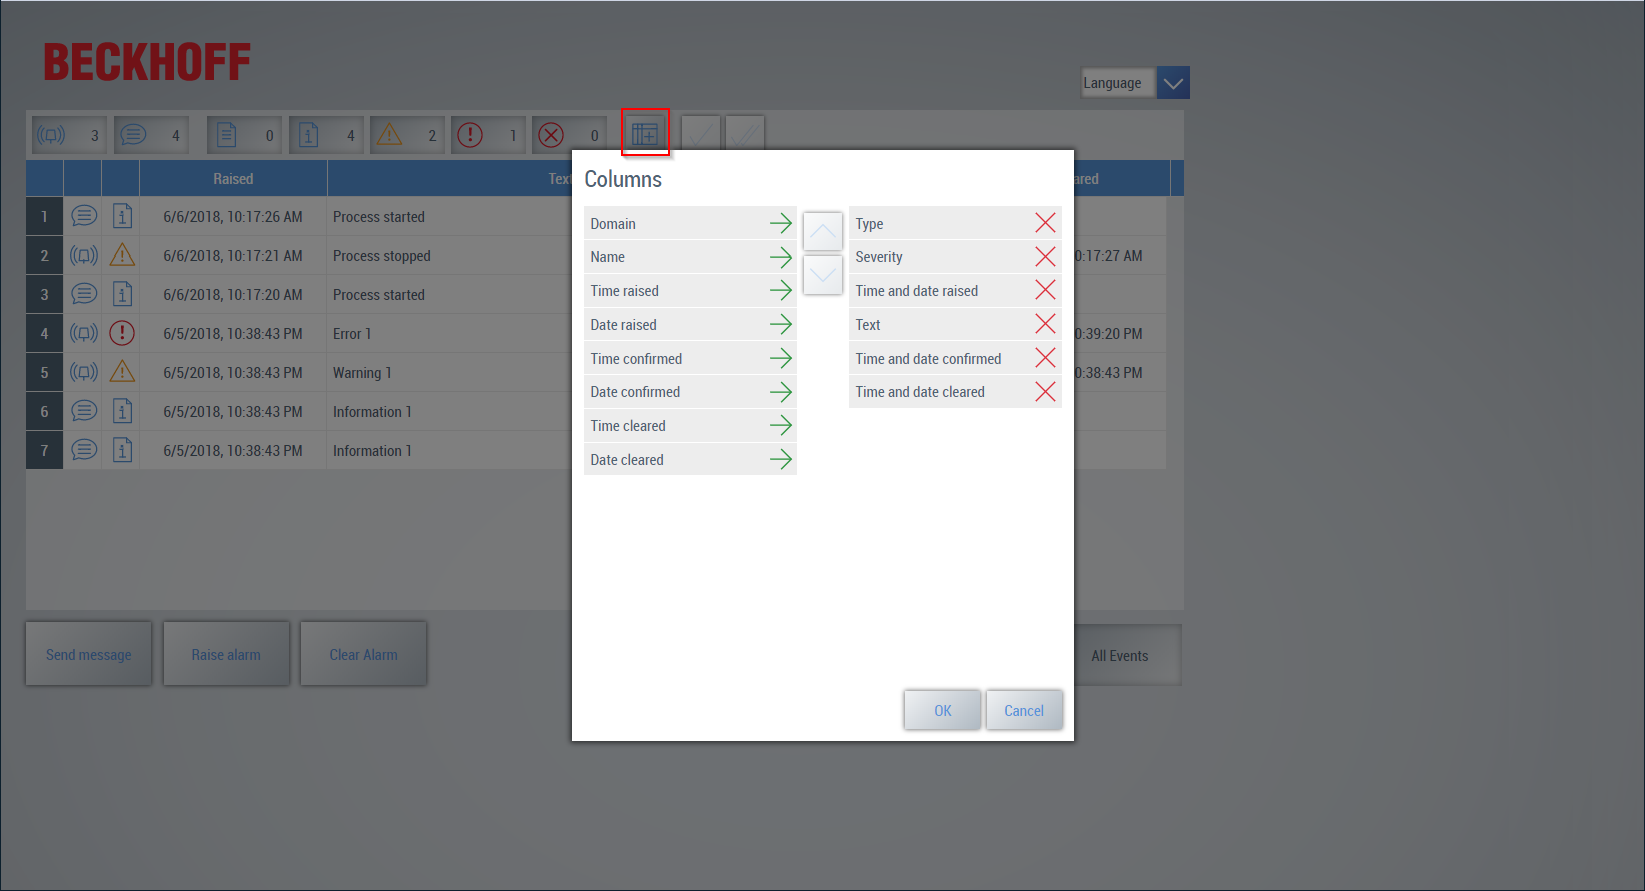
The configuration of the columns defines which columns are displayed in the Event Grid control. By default the type (alarm or message), the severity, the timestamp of the input and the associated text are displayed. Further columns such as the time of the confirmation can be configured in the control's properties. The settings apply to all clients.
There is an option at runtime to change the columns displayed per client. To do this, open the column editor from the menu bar. The column editor automatically opens a pop-up with an overlay and positions itself in the center of the view:
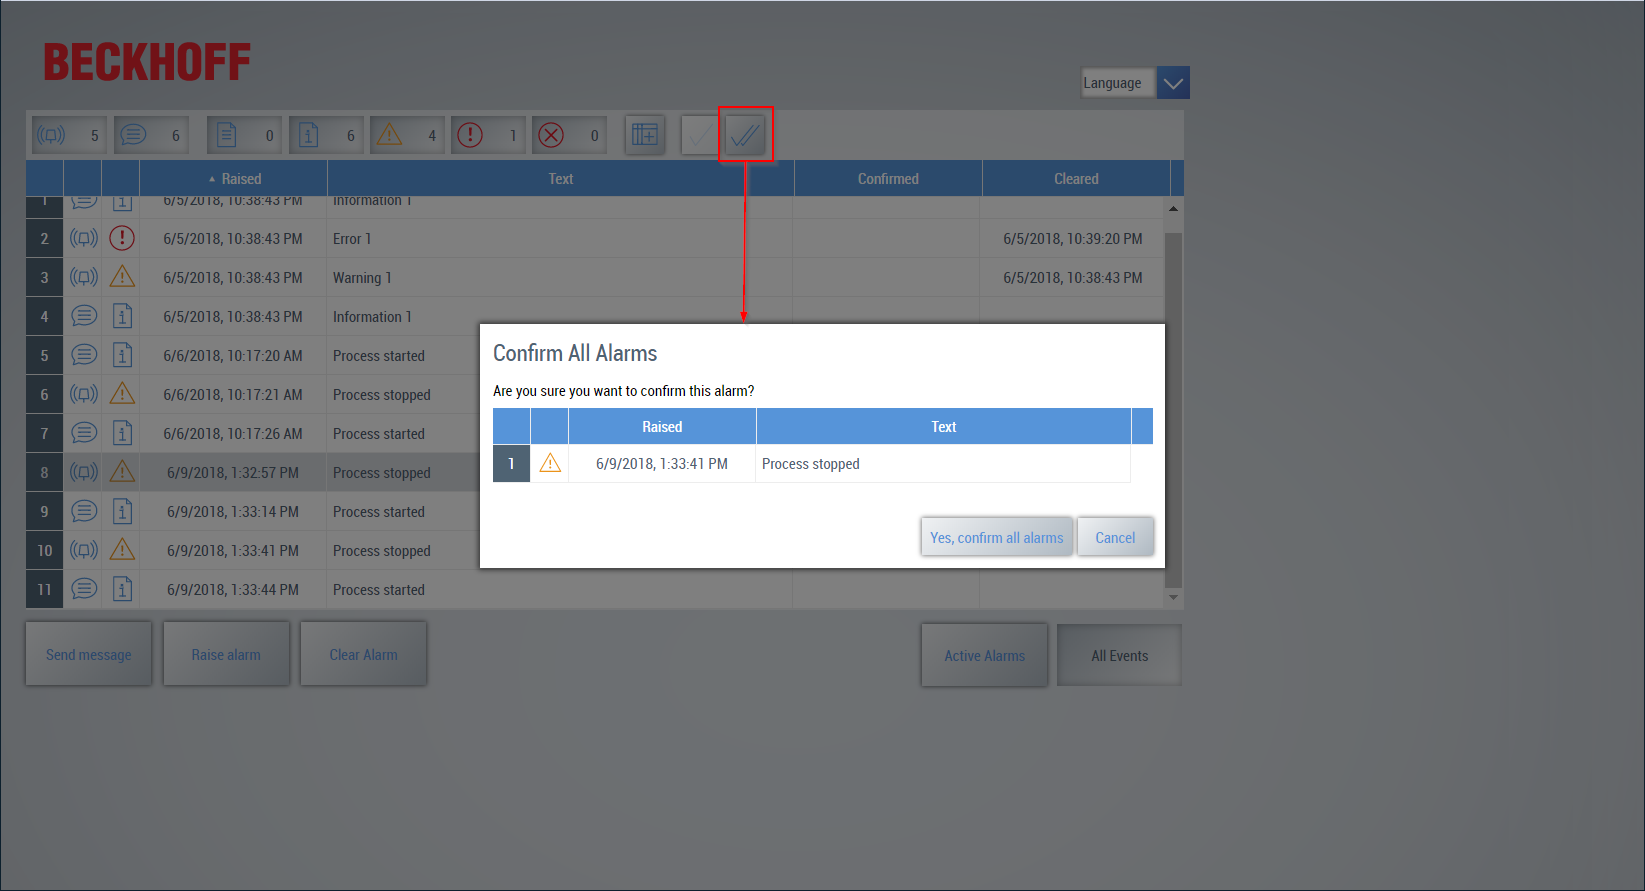
Confirming an alarm
An alarm can be confirmed by selecting the row containing the alarm and clicking on the button Confirm alarm (single check mark) in the menu bar.
If several alarms are active, there is an option to confirm all alarms simultaneously. To do this, click on the button Confirm All Alarms (two check marks) in the menu bar. A pop-up with an overlay then opens automatically and displays all active alarms. At this point, you have the option of canceling the dialog or confirming all active alarms.