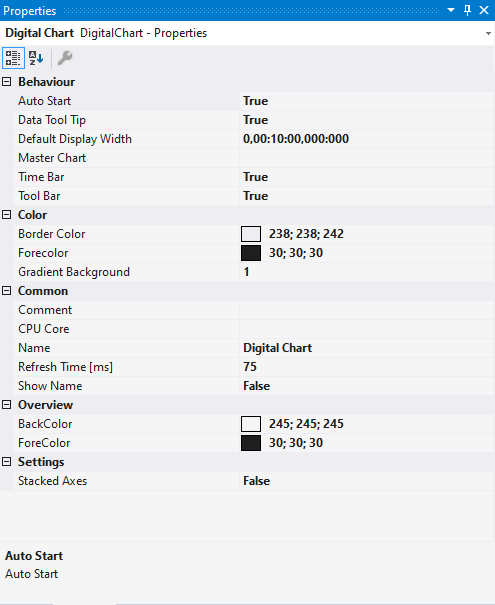
Digital Chart properties
All settings assigned to the Digital Chart can be made here.

Behaviour
AutoStart | If this option is enabled, the chart starts the live display when a new recording is started. |
Data Tool Tip | If this option is activated, a tool tip showing the exact values of a data point is displayed when clicking on the data point. The time stamp and the name of corresponding channel are also shown. |
Default Display Width | This time specifies the standard width of the associated chart. This value determines the period between the displayed minimum and maximum values. |
Master Chart | In the drop-down list that is available here, a chart that is part of the current configuration can be selected and designated as master chart. All actions that are executed in the master chart are also automatically executed in this chart. Only the Overview Chart can be shown in the toolbar. |
Time Bar | Specifies whether the time bar (information bar with time values) is displayed in the chart. |
Tool Bar | Specifies whether the toolbar is displayed in the chart. |
Color
Border Color | Defines the background color of the chart. |
Forecolor | Specifies the color of the chart name. |
Gradient Background | Provides for a color gradient in the background color. |
Common
Comment | A free comment can be saved here. |
CPU Core | Here you can set (for each chart individually) which CPU core should be used for the current chart display. If required, multiple CPU cores can be specified for a chart. This may improve the performance. |
Name | The name of the chart. |
Refresh Time [ms] | Defines the interval in which new values are to be displayed. |
Show Name | Specifies whether the name of the chart is shown in the graph. |
Overview
BackColor | Specifies the background color of the overview. |
ForeColor | Specifies the color of the axis labels and grids of the overview. |
Time Picker Color | Specifies the color of the Time Picker. |
Settings
Stacked Axes | Defines the stacking direction for axes. False for horizontal stacking of the axes and true for vertical stacking. |
The chart display is operated with the toolbar. The overview shows all buttons and their explanation (from left):

Play | Starts the live display mode. The currently pending data are displayed. |
Break | Stops the live display mode and changes to the break mode. Here you can navigate in the data already recorded without stopping the recording. |
Display width | The current display width is displayed here. It can be edited in the format hh:mm:ss,fff. The zoom function works down to the µs range. |
Scroll buttons | The outer scroll buttons move the current display in steps that correspond to the display width. The inner scroll buttons move the display only by a tenth of the display width and can be kept pressed to view the data set. |
Position | Shows the position. It can be edited in the format hh:mm:ss,fff. The colons are used as separators. If not all units are edited the format is sorted in ascending order, starting with seconds. |
Undo/Redo Time/Position | This option can be used to undo step changes in the display width or the current position, irrespective of how they were made (e.g. zoom, scroll, etc.). Once undone, values can be repeated with redo. |
Zoom to Default | Resets the display width to the Default Display Width. |
Zoom Out Max | Sets the display range to the maximum recording length. |
Overview | Use the Overview option to display a chart within the chart. The signal range currently shown in the main chart is highlighted in the Overview Chart. In addition the overview chart offers an absolute time axis for the entire recording duration. |
The current recording times are displayed in the chart toolbar:

Start-Time | The common starting point of the recordings of all connected channels. The start time defines the zero point of the recording. |
End-Time | Maximum common time of all connected channels. The end time thus marks the final value of the recording. The difference between the end time and start time is maximally as large as the record time set (see Scope nodes). |
Position | The position time represents the zero point of the current chart, i.e. the time from the start time to the beginning of the display. |
Time | Absolute time at the chart origin |
Date | Absolute date at the chart origin |