Dynamic Style
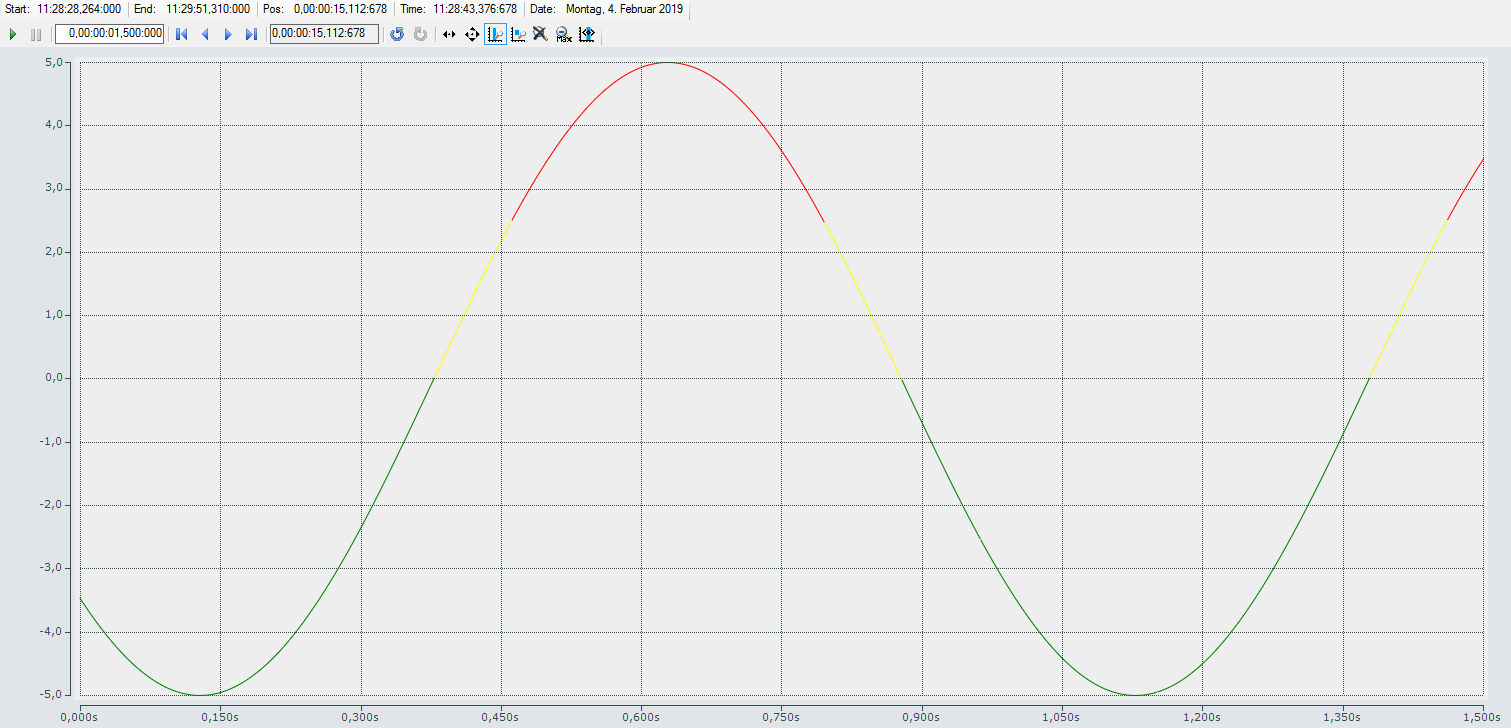
With the aid of Dynamic Styles the appearance of a channel can be adapted section-wise using an additional data series. Hence sections of the graph can be displayed in a different color, dashed, invisible or thicker.
 | Restrictions with GDI+ There is a restriction that no color change and no dashed lines can be implemented as a Dynamic Style with the GDI+ graphics library. If these two style switches do not work for you, please check the graphic settings in the Scope > Graphic Library menu |
Any number of Dynamic Styles can be appended to a graph. Each Dynamic Style makes a change to a property of the graph (e.g. changing the color to red). Under each Dynamic Style there must be at least one condition that defines whether this action is to be executed with the current data value. Several conditions are also possible, which are then "ANDed" or "ORed".
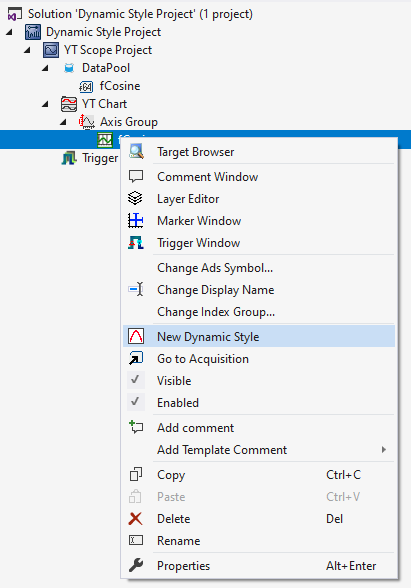
A Dynamic Style is added via the context menu of the channel.
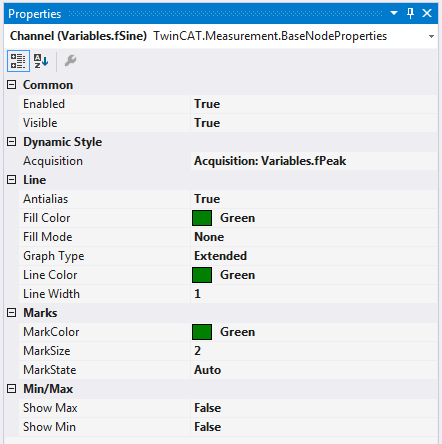
If a channel contains at least one Dynamic Style, then a new entry "Acquisition" is displayed in the "Dynamic Style" group in the properties window of the channel. The data series for all dynamic styles can be defined here. This must be recorded by the same target system and sampled with the same sampling rate as the other data series of the channel.
Dynamic Styles can be used on channels in XY charts as well as on channels in YT charts. This opens up a wide range of possible applications. Also in the Motion area for the illustration of contours or simple alarm states.