Creating and configuring a Measurement Wizard project
- TwinCAT is in RUN mode and the PLC project in online mode.
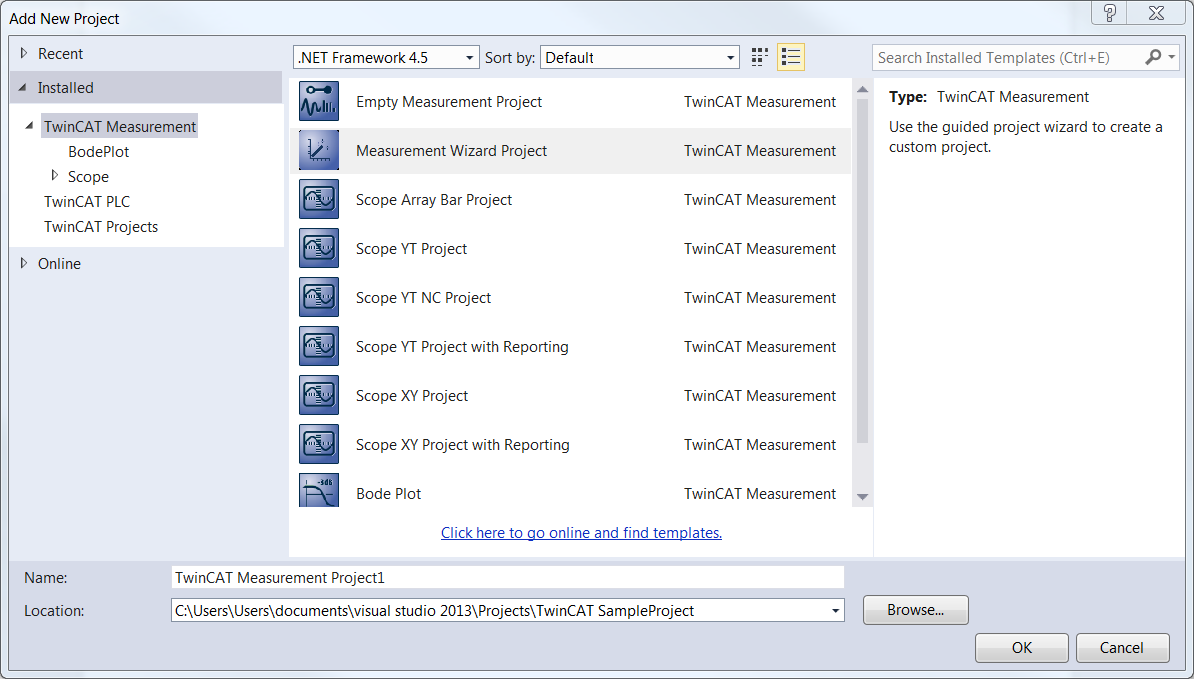
- 1. In the menu File > New select the command Project.
- 2. In the dialog that opens, select the TwinCAT Measurement category and the Measurement Wizard Project template.
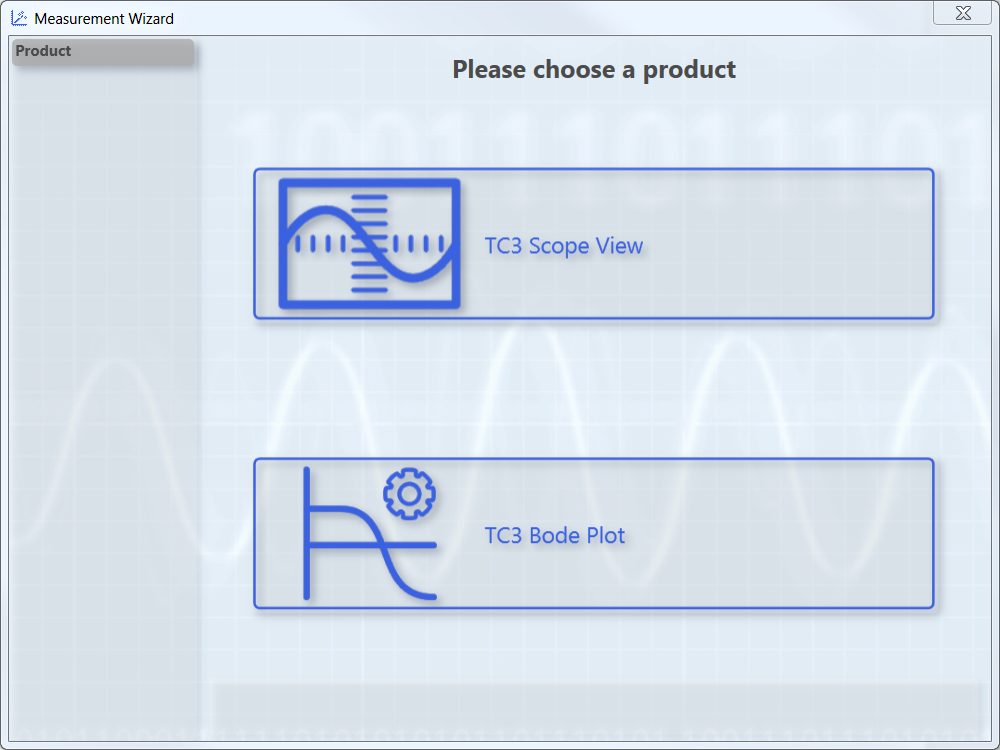
- The Measurement Wizard for TC3 Scope View, TC3 Bode Plot and TC3 Filter Designer opens.
- 3. Select TC3 Scope View.
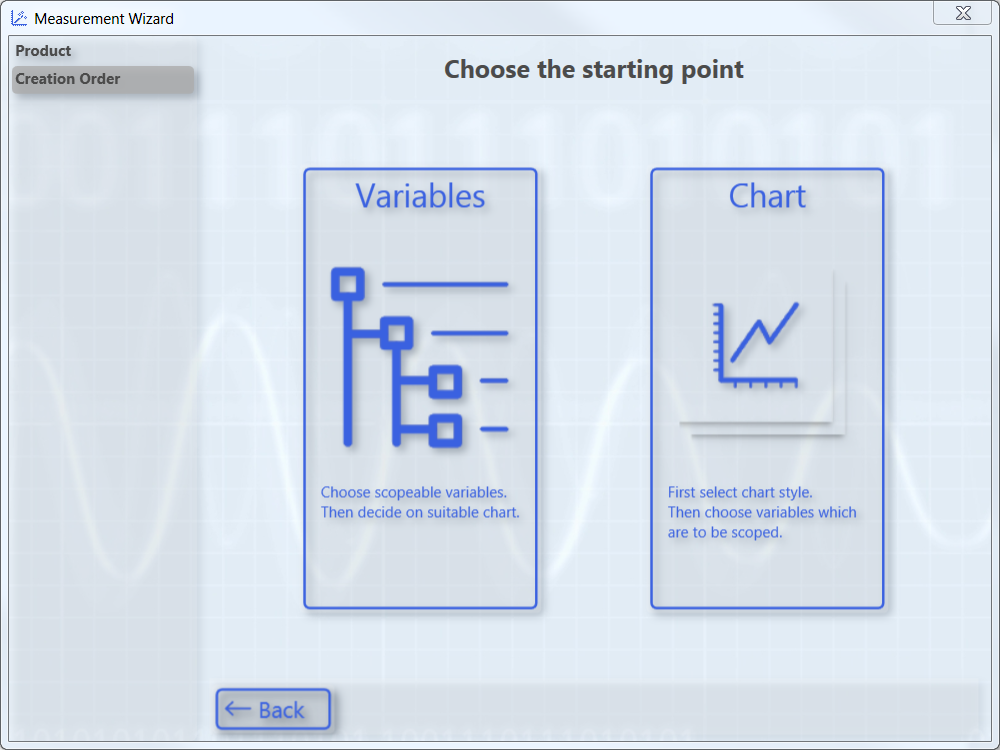
- If you wish to select the variables to be recorded and displayed as a graph first and then the appropriate chart, select the "Variables" option. If you wish to select the chart first and then the variables, select the "Chart" option.
Selecting variables and then chart (Variables option)
- In the Measurement Wizard you selected the Variables option as the starting point.
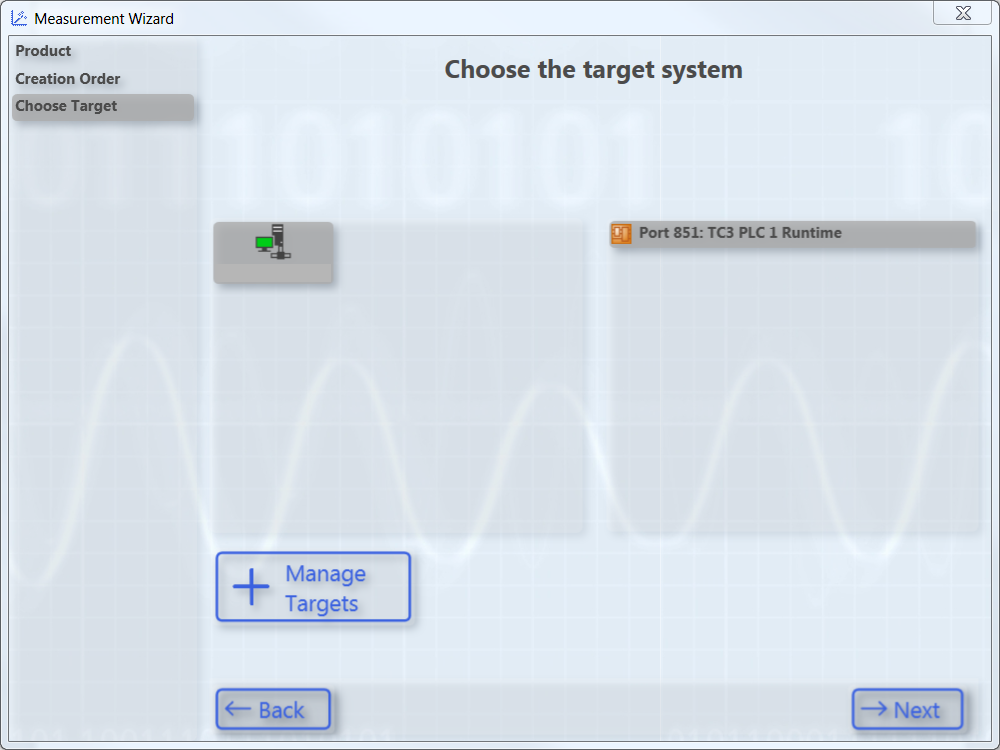
- 1. Select the target system and the corresponding ADS port. Optionally you can open the TwinCAT Static Routes dialog via the Manage Targets button in order to obtain information about the routes of the local TwinCAT system and to add new routes. Click on Next.
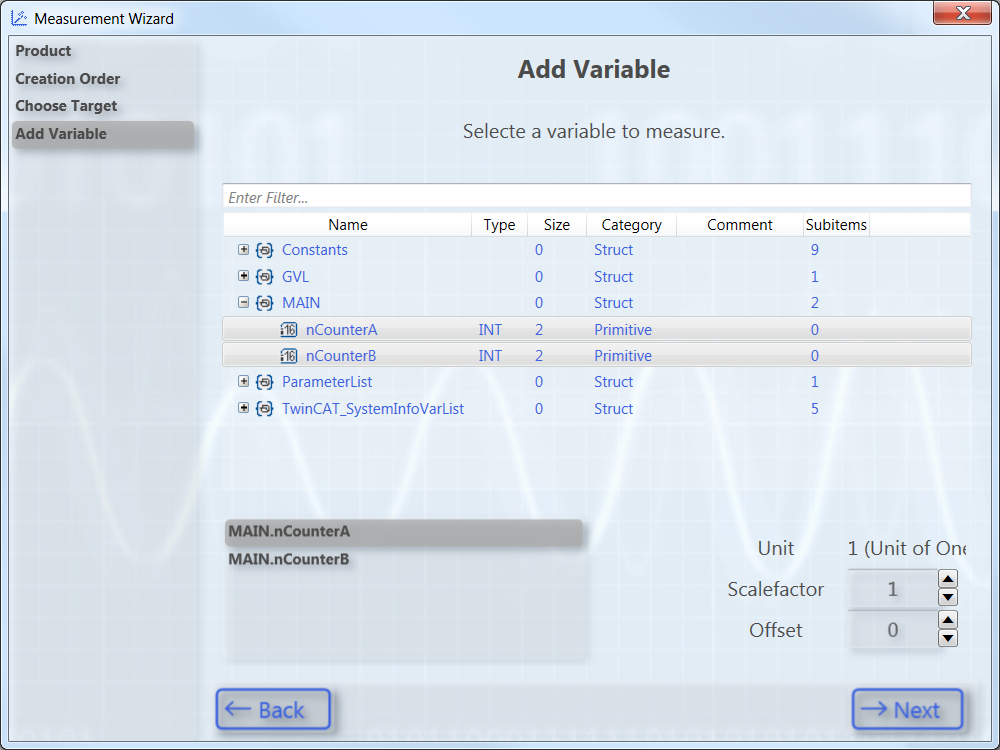
- 2. Select the variables that are to be recorded and displayed as a graph. To do this, navigate through the menu or enter a variable name in the filter text field. Optionally you can select a different scaling factor and an offset. Furthermore, you have the option to specify a warning level and an alert level. With these values you configure the dynamic style function for these variables. From the warning value the graph is drawn in yellow and from the alert in red. Click on Next.
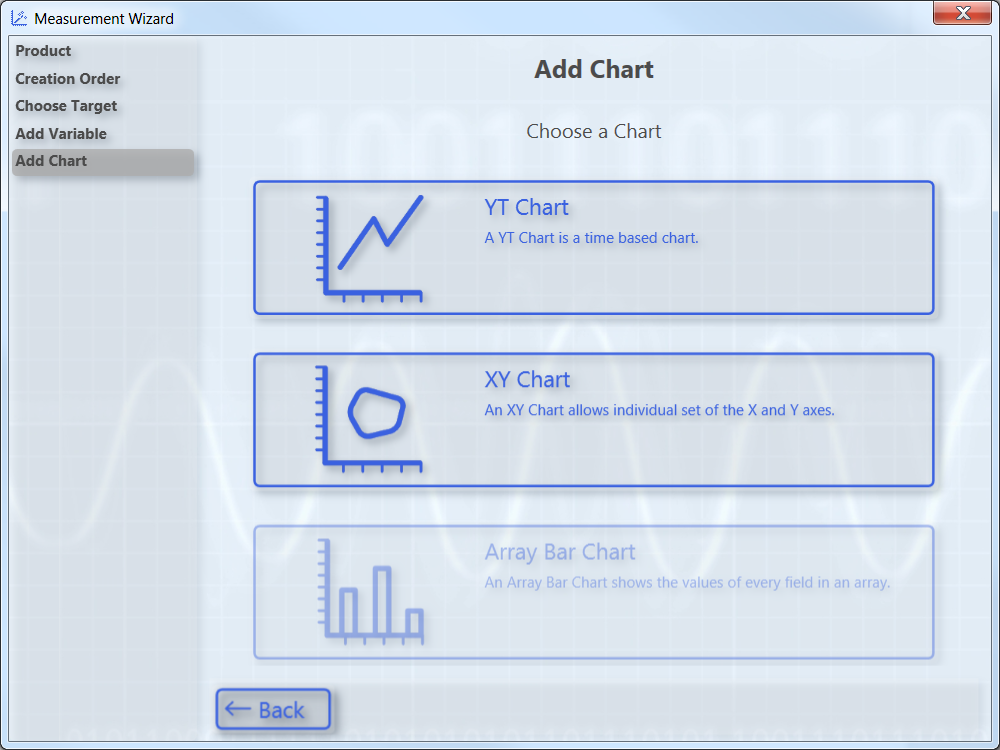
- 3. Select the chart type. You can only select chart types that match your variable selection. Here is an example of an XY chart.
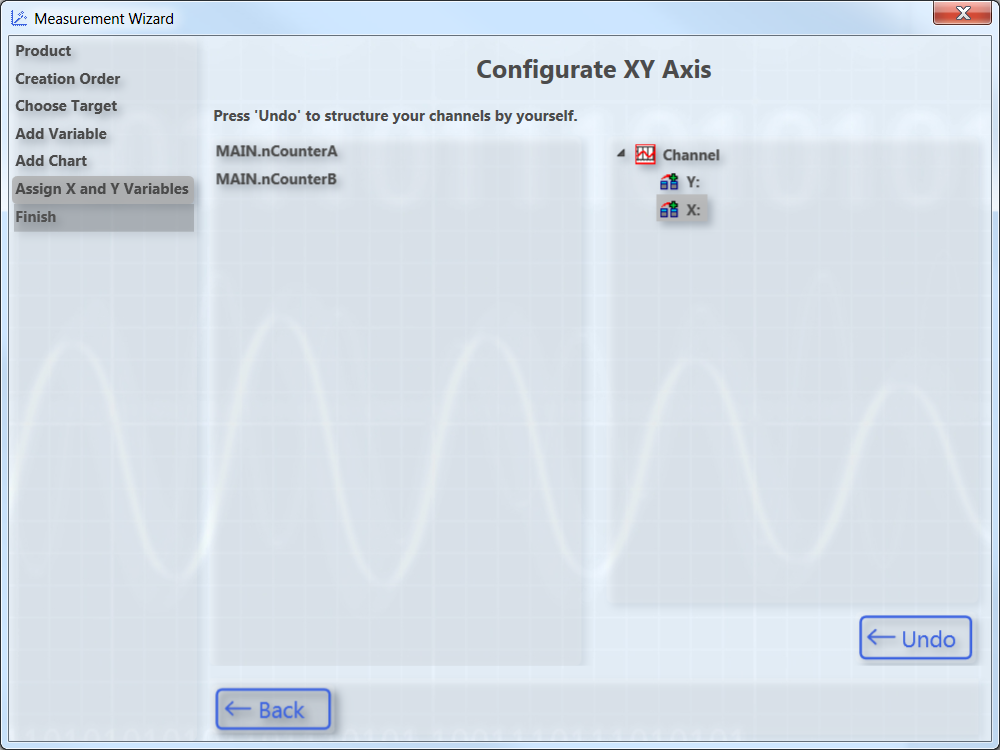
- 4. Configure the axes. To do this, assign variables to the axes by marking the respective pairs. You can reset the selection with Undo. Click on Next.
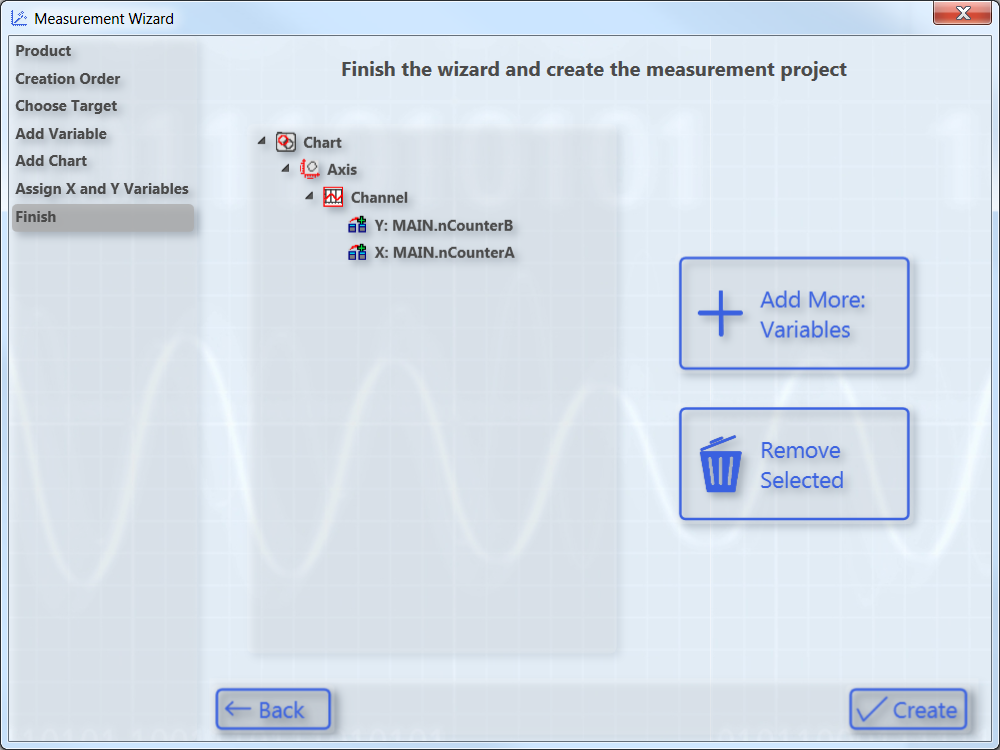
- The subsequent configuration step Finish shows an overview of the settings.
- 5. To delete a configured element again, mark it and click on Remove Selected. To add further variables to the configuration, click on Add More: Variables. Click on Create to end the configuration and create the project.
- A TwinCAT Measurement Project with a ScopeWizard project is added to the Solution.
Selecting chart and then variables (Chart option)
- In the Measurement Wizard you selected the Chart option as the starting point.
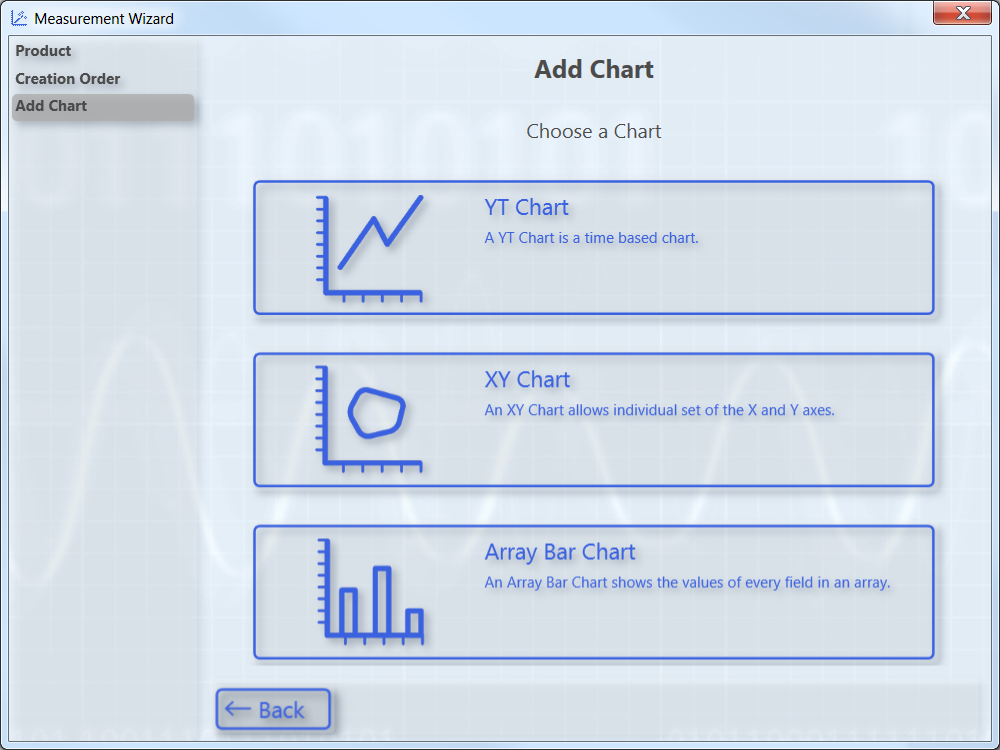
- 1. Select the chart type.
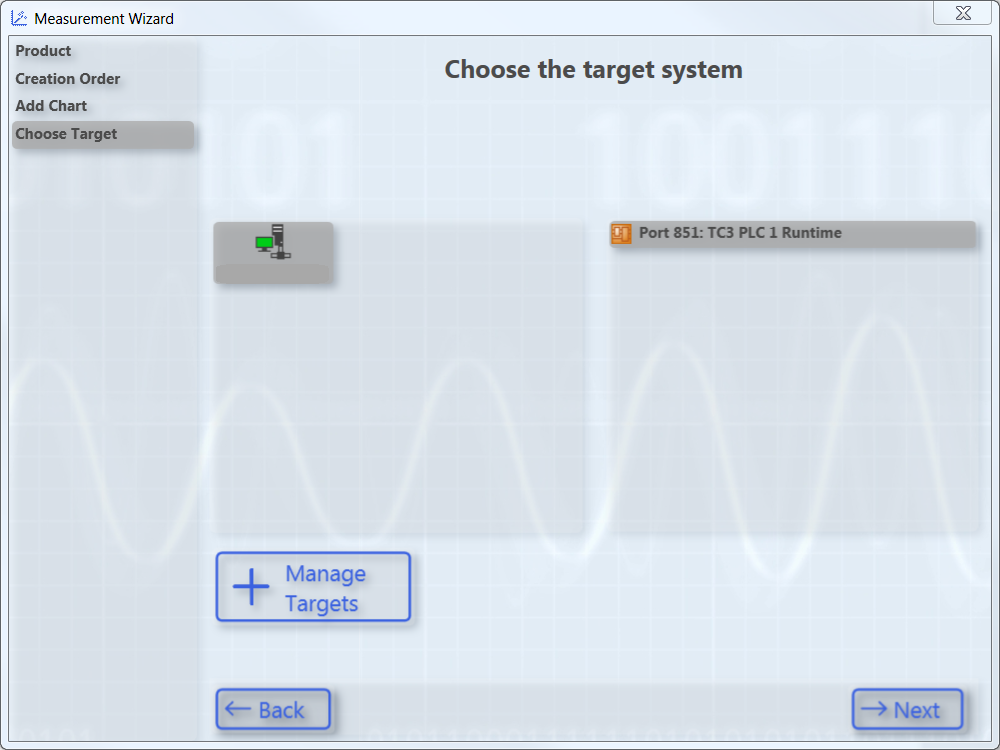
- 2. Select the target system. Optionally you can open the TwinCAT Static Routes dialog via the Manage Targets button in order to obtain information about the routes of the local TwinCAT system and to add new routes. Click on Next.
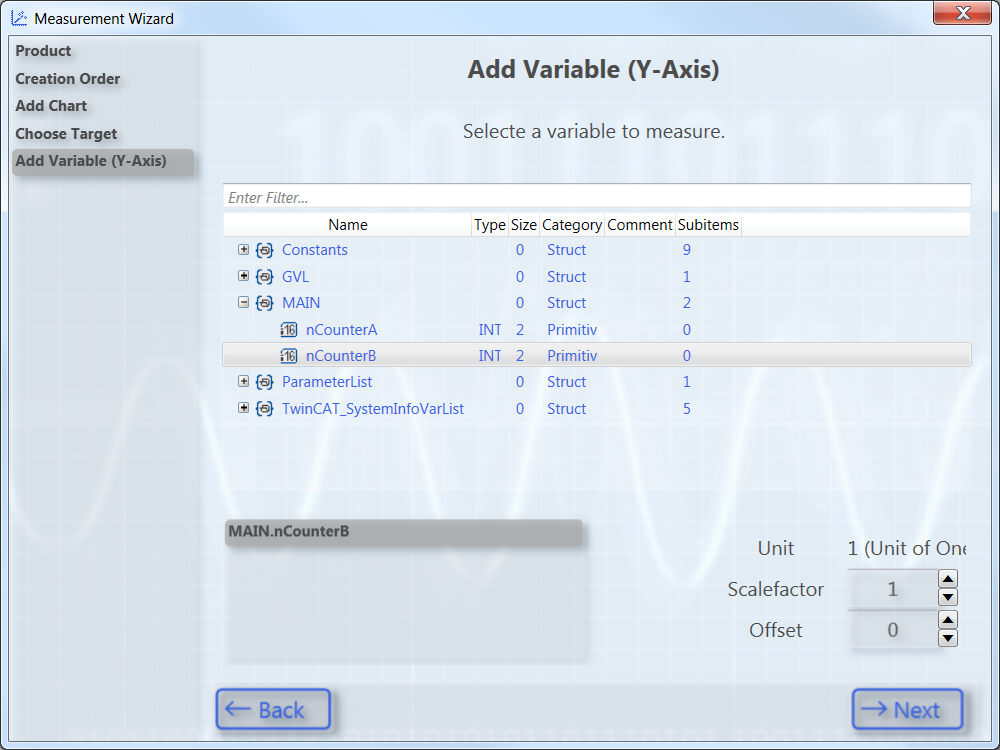
- 3. Assign a variable to the Y-axis. To do this, navigate through the menu or enter a variable name in the filter text field. Optionally you can select a different scaling factor and an offset. Furthermore, you have the option to specify a warning level and an alert level. With these values you configure the dynamic style function for these variables. From the warning value the graph is drawn in yellow and from the alert in red. Click on Next.
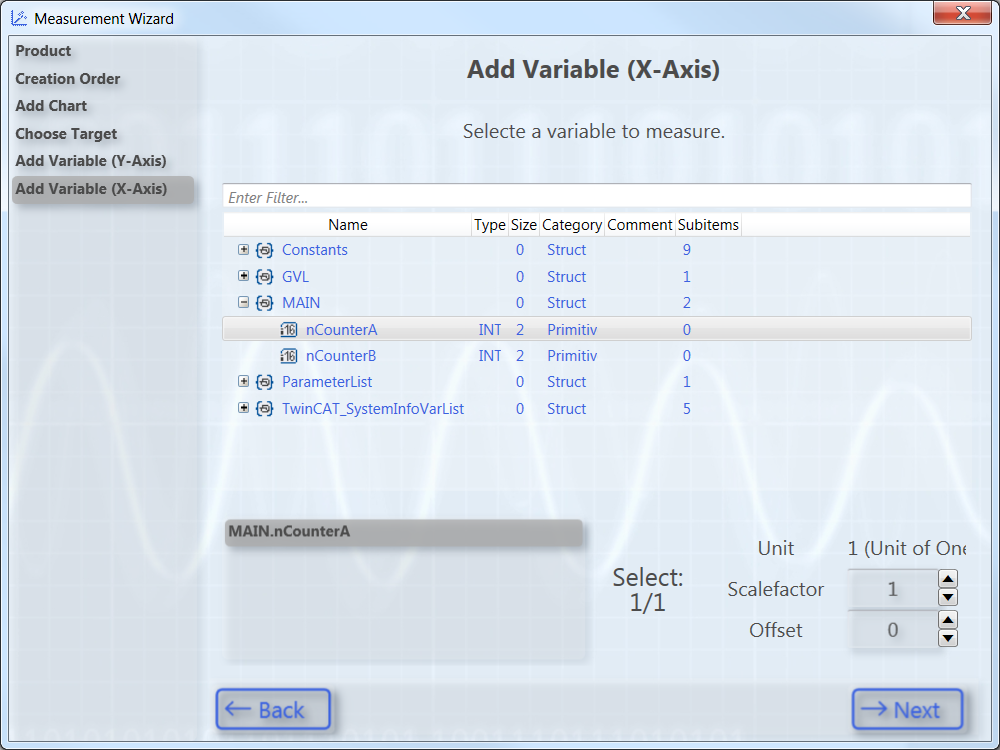
- 4. Assign a variable to the X-axis. To do this, navigate through the menu or enter a variable name in the filter text field. Optionally you can select a different scaling factor and an offset. Click on Next.
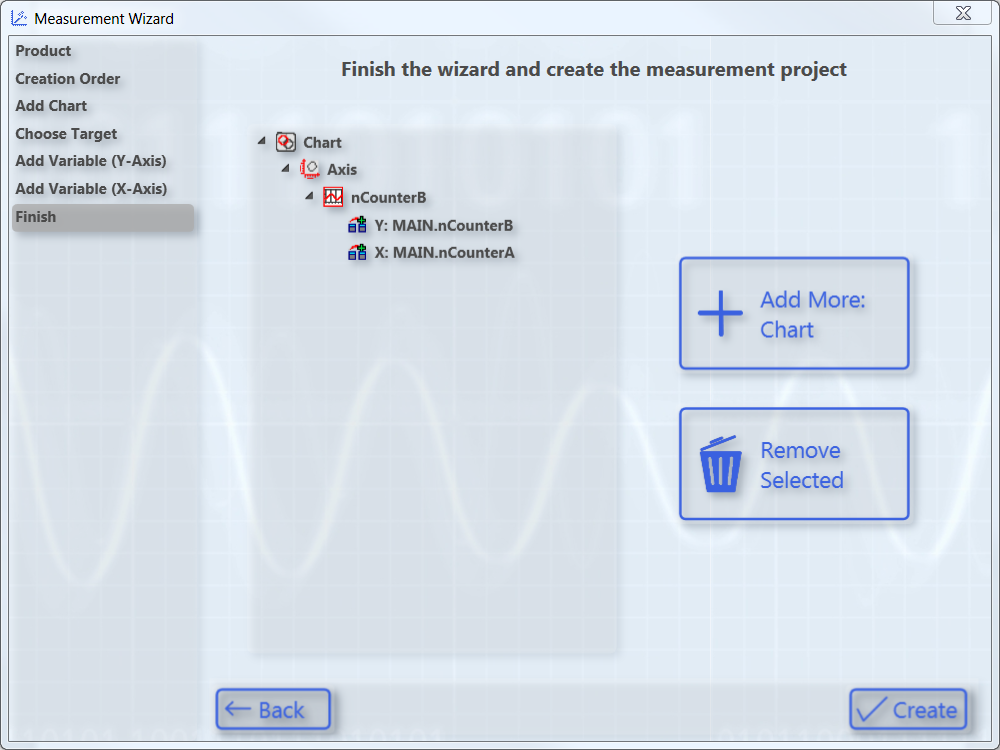
- The subsequent configuration step Finish shows an overview of the settings.
- 5. To delete a configured element again, mark it and click on Remove Selected. To add a further chart to the configuration, click on Add More: Chart. Click on Create to end the configuration and create the project.
- A TwinCAT Measurement Project with a ScopeWizard project is added to the Solution.