Table Chart properties
All settings assigned to the Table Chart can be made here
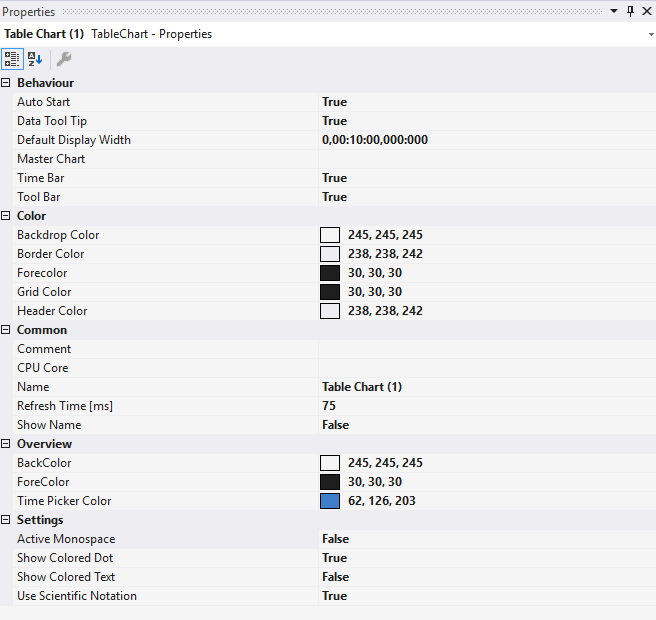 Fig.1:
 Behaviour
AutoStart | If this option is enabled, the chart starts the live display when a new recording is started. |
Data Tool Tip | If this option is activated, a tool tip showing the exact values of a data point is displayed when clicking on the data point. The time stamp and the name of corresponding channel are also shown. |
Default Display Width | This time specifies the standard width of the associated chart. This value determines the period between the displayed minimum and maximum values. |
Master Chart | In the drop-down list that is available here, a chart that is part of the current configuration can be selected and designated as master chart. All actions that are executed in the master chart are also automatically executed in this chart. Only the Overview Chart can be shown in the toolbar. |
Time Bar | Specifies whether the time bar (information bar with time values) is displayed in the chart. |
Tool Bar | Specifies whether the toolbar is displayed in the chart. |
Color
Backdrop color | Sets the background color behind the table content. |
Border Color | Sets the border color of the overview chart. |
Forecolor | Sets the color of the chart name and text elements. |
Grid Color | Sets the color of the grid lines separating rows and columns. |
Header Color | Sets the background color of the column headers. |
Common
Comment | A free comment can be saved here. |
CPU Core | Here you can set (for each chart individually) which CPU core should be used for the current chart display. If required, multiple CPU cores can be specified for a chart. This may improve the performance. |
Name | The name of the chart. |
Refresh Time [ms] | Defines the interval in which new values are to be displayed. |
Show Name | Specifies whether the name of the chart is shown in the graph. |
Overview
BackColor | Specifies the background color of the overview. |
ForeColor | Specifies the color of the axis labels and grids of the overview. |
Time Picker Color | Specifies the color of the Time Picker. |
Settings
Active Monospace | When enabled, all text uses a monospace font where each character occupies the same horizontal width. This ensures that digits in vertical columns align perfectly (e.g., units, tens, hundreds), making it easier to spot value changes and compare magnitudes across rows. |
Show Colored Dot | When enabled, displays a small colored dot indicator next to each channel row. The dot color typically corresponds to the channel's assigned color, providing quick visual identification of channels in large configurations. |
Show Colored Text | When enabled, the value text itself is rendered in the channel's assigned color instead of the default foreground color. This helps distinguish between different channels when viewing multiple values. |
Use Scientific Notation | When enabled, large or small numerical values are displayed using scientific notation (e.g., 1.23e+06 instead of 1230000). This is useful for channels with values that span many orders of magnitude, keeping the display compact and readable. |
Tool Bar
The toolbar controls the chart display. Overview of all buttons (from left to right):
Play | Starts live display mode. Currently arriving data is shown. |
Pause | Stops live display mode and switches to pause mode. Navigate through recorded data without stopping the recording. |
Min/Max Range | Shows the width of the min/max values. |
Scroll Buttons | Outer buttons move display by full display width; inner buttons move by one-tenth and can be held. |
Value Position | Shows current value position. |
Min/Max Range start | Shows the start position of the min/max range. |
Undo/Redo | Revert or redo display width or position changes. |
Zoom to Default | Reset display width to Default Display Width. |
Zoom Out Max | Set display range to maximum recording length. |
Overview | Overview displays a small YT-chart with all numerical values. |
Take Snapshot | Capture current values of all (or filtered) channels. |
Active Monospace | Toggles the active monospace setting. |
Chart Snipping Tool | Take Screenshots of chart, edit and send them, see Chart Snipping Tool. |