Extension – TcAnalytics
With the help of the TcAnalytics Extension of the TwinCAT Target Browser, MQTT data streams from different brokers and topics can be displayed and made available for different measurement products. All you have to do is drag and drop the desired stream symbols into the corresponding engineering tools.
Specific Target Area
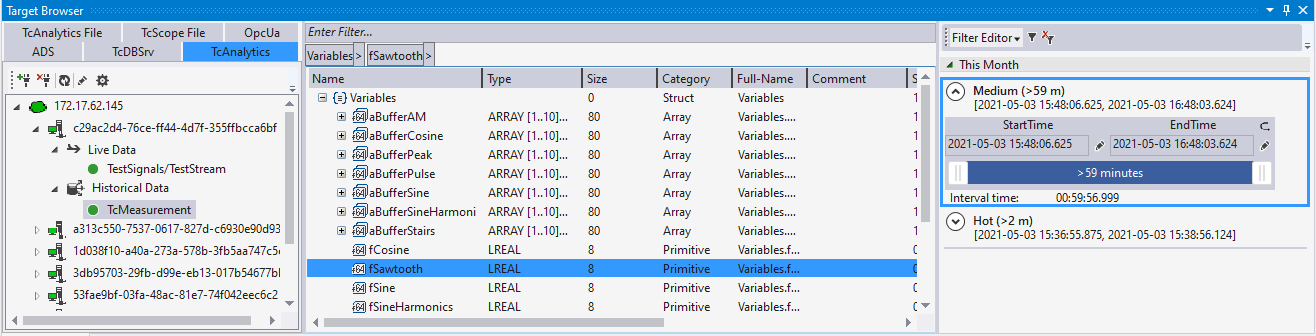
In the left area of the TwinCAT Target Browser (TcAnalytics) all brokers and their data streams are displayed in a tree structure. In addition, historical data streams are also displayed. The current status of the system or the data stream is indicated by the preceding symbols (green: available, red: unreachable, gray: unknown status).
Toolbar
The toolbar of the TcAnalytics extension provides the following functions:
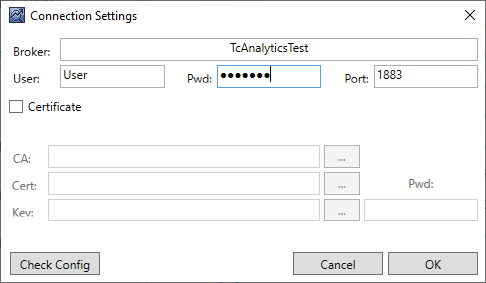
Add broker connection
| This button can be used to add broker connections.
|
Delete broker connection | This button can be used to delete existing connections to a broker from the tree. |
Refresh
| The display of the target system states can be manually updated with this button. |
Edit connection | This button can be used to subsequently change the connection parameters. |
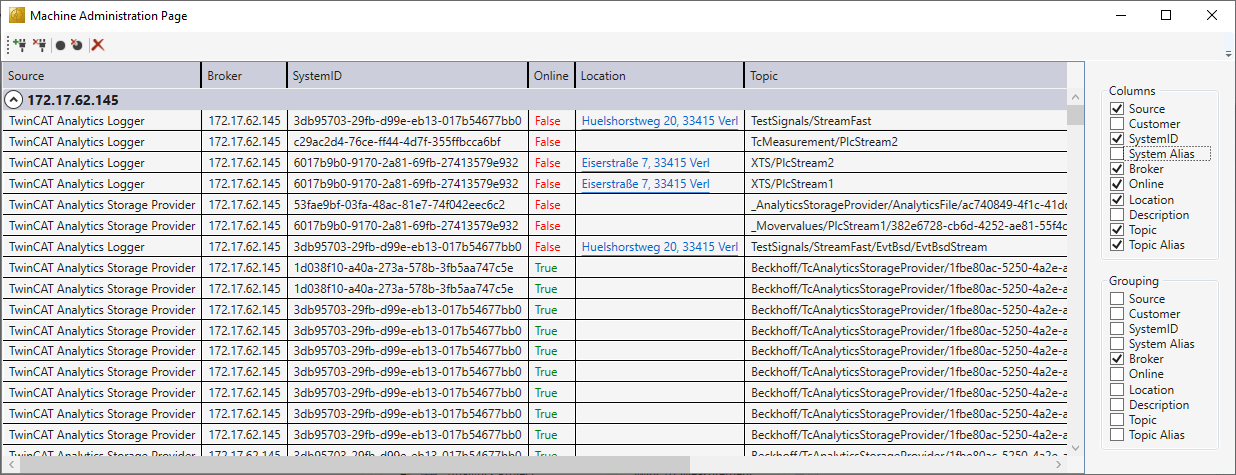
Machine Administration Page | This button opens the machine administration page. The incoming data streams of the various "machines" can be managed via this page. |


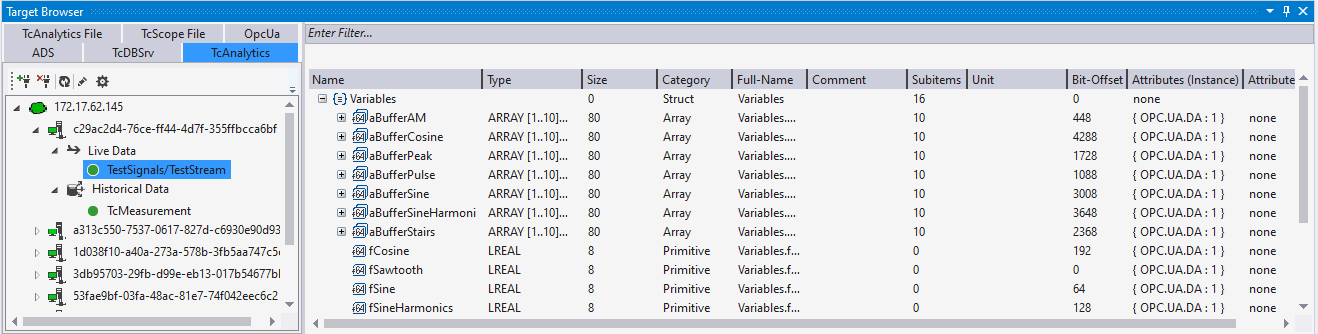
Common Symbol Area
The symbols of the different data streams are displayed in the right-hand area of the TwinCAT Target Browser (TcAnalytics). In addition to the name, data type, size and symbol name, attributes are also displayed, for example. Special attributes, such as those of the units, are interpreted and output in their own columns. If a historized data stream is selected, the individual recordings and their time ranges are also displayed.