XYZ-axis properties
Here you can find all settings for the axes in an XYZ chart.
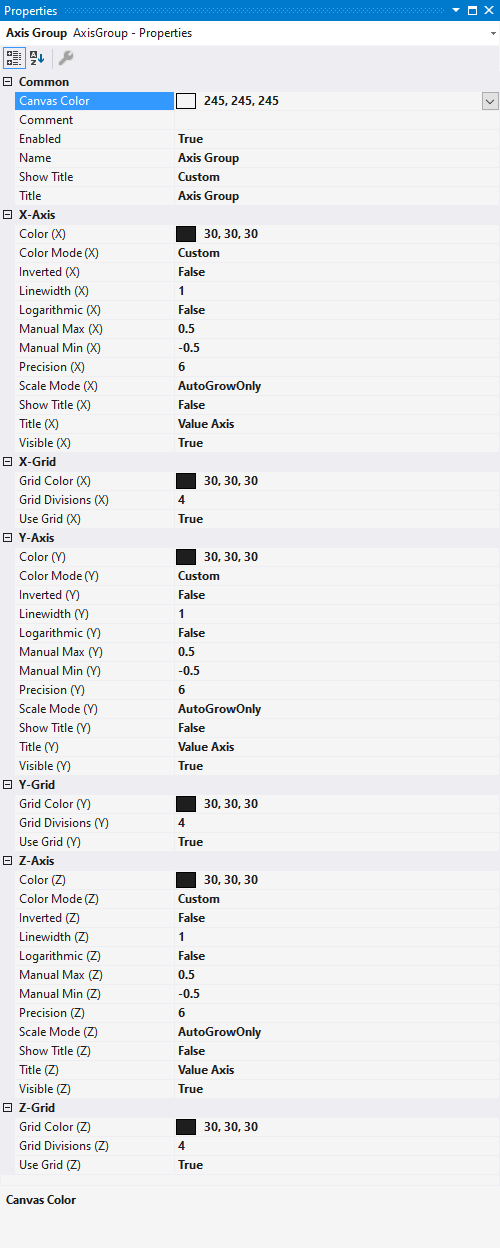
Common
Canvas Color | Here you can set the background color of the drawing area. |
Comment | Here you can add a free comment. |
Enabled | Shows/hides the entire axis. |
Name | Indicates the name of the axis group. This is used in the Solution Editor. |
Show Title | Determines which title is displayed above the chart. This function is only displayed if there is only one axis group, or if the axis groups are not stacked. Hide: no title is displayed Custom: the value from the 'Title' setting is displayed Name: the name of the axis group is selected X-Axis Title: the title of the X-axis is reused Y-Axis Title: the title of the Y-axis is reused First Channel: the name of the first channel is reused Below that, all channels are listed in order to select them explicitly. |
Title | If Shot Title is set to 'Custom', this title will be displayed above the chart. |
(X/Y/Z) axis
Color (X/Y/Z) | Color of the axis. |
Color Mode (X/Y/Z) | Defines which color is displayed at the axis. Custom: the value from the 'Color Mode' setting is displayed First Channel: the name of the first channel is reused Below that, all channels are listed in order to select them explicitly. |
Inverted (X/Y/Z) | Inverts the scaling of the axis |
Line Width (X/Y/Z) | Specifies the line width of the axis |
Logarithmic (X/Y/Z) | Specifies whether the axis is scaled logarithmically. |
Manual Max (X/Y/Z) | Specifies the maximum value for manual scaling. |
Manual Min (X/Y/Z) | Specifies the minimum value for manual scaling. |
Precision (X/Y/Z) | Specifies the number of significant digits for the axis label. |
Scale Mode (X/Y/Z) | Specifies the Scale Mode for the axis. There are three modes to choose from. In case of Manual, the range of the axis can be fixed. AutoGrowOnly automatically increases the area of the axis, if data points are outside the specified range. AutoGrowNShrink further shrinks the range if extreme values in the data are no longer in the displayed time range. |
Show Title (X/Y/Z) | Specifies whether to display the title of the axis. |
Title (X/Y/Z) | Axis title |
Visible (X/Y/Z) | Toggles the visibility of the axis label. |
(X/Y/Z) Grid
Grid Color (X/Y/Z) | Color of the grid. |
Grid Divisions (X/Y/Z) | Maximum number of grid subdivisions. If the drawing space is insufficient for the number of divisions, the system automatically switches to fewer divisions. |
Use Grid (X/Y/Z) | The X-divisions can be switched on and off here. |