Chart tab
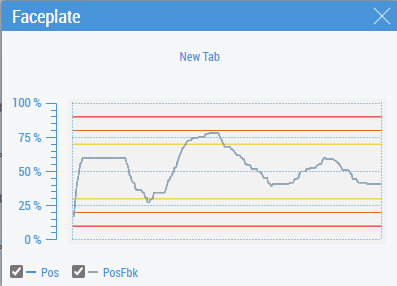
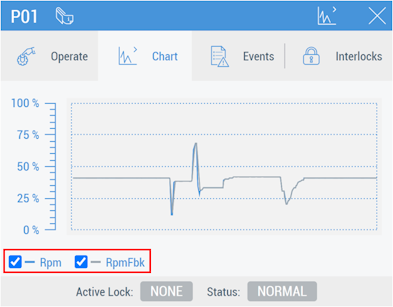
The set of charts and limit lines on the Chart tab depends on the type of DataAssembly that MTP PLC Library FB presents. The charts can be hidden using the corresponding controls:
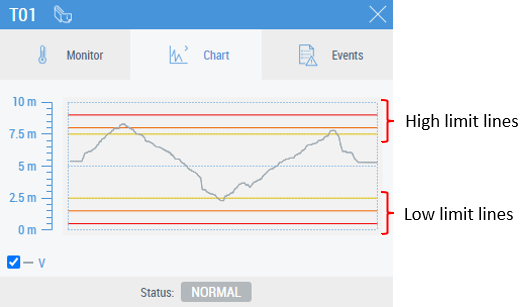
An example on limit lines:
Parameters
The following table shows the description of the Faceplate_Chart.usercontrol parameters:
Parameter | Description | Type | Example |
|---|---|---|---|
DataSymbolPath1 | SymbolPath to a variable 1 | String | ADS.PLC1.GVL_MTP.H01.V |
DataSymbolPath2 | SymbolPath to a variable 2 | String | ADS.PLC1.GVL_MTP.H01.VFbk |
DataSymbolPath3 | SymbolPath to a variable 3 | String | ADS.PLC1.GVL_MTP.H01.VInt |
SclMin | Minimum value of chart scale | REAL | %s%ADS.PLC1.GVL_MTP.V03::PosSclMin%/s%, which looks like this while binding:
|
SclMax | Maximum value of chart scale | REAL | %s%ADS.PLC1.GVL_MTP.V03::PosSclMax%/s%, which looks like this while binding:
|
Unit | Units | Number | %s%ADS.PLC1.GVL_MTP.V03::PosUnit%/s%, which looks like this while binding:
|
HHHEn | Show the line for HiHiHi Limit | BOOL |
|
HHH | Line for HiHiHi Limit | REAL | 90 or
|
HHEn | Show the line for HiHi Limit | BOOL |
|
HH | Line for HiHi Limit | REAL | See examples for HHH |
HEn | Show the line for Hi Limit | BOOL |
|
H | Line for Hi Limit | REAL | See examples for HHH |
LEn | Show the line for Low Limit | BOOL |
|
L | Line for Low Limit | REAL | See examples for HHH |
LLEn | Show the line for LowLow Limit | BOOL |
|
LL | Line for LowLow Limit | REAL | See examples for HHH |
LLLEn | Show the line for LowLowLow Limit | BOOL |
|
LLL | Line for LowLowLow Limit | REAL | See examples for HHH |


Variables which are set in DataSymbolPath[N] (N is a number, e.g. 1, 2, 3) are automatically historized when the faceplate is configured in the TwinCAT HMI Engineering. The same occurs when using PLC attributes, but the variable should be preceded by the Chart attribute (see example of configuring Chart tab using PLC attributes).
Reusing the Chart tab with the Tabs property
Faceplate_Chart.usercontrol can be used as a customized tab for a faceplate. A maximum of three variables can be chosen to draw charts.
 | Setting symbols as historized To show the chart, the symbols, bound to the DataSymbolPath1 … DataSymbolPath3 parameters should be set as Historized. |
Faceplates/Faceplate_Chart.usercontrol should be chosen for the Target File property in the Tabs configuration window. An example of parameter configuration is shown below:
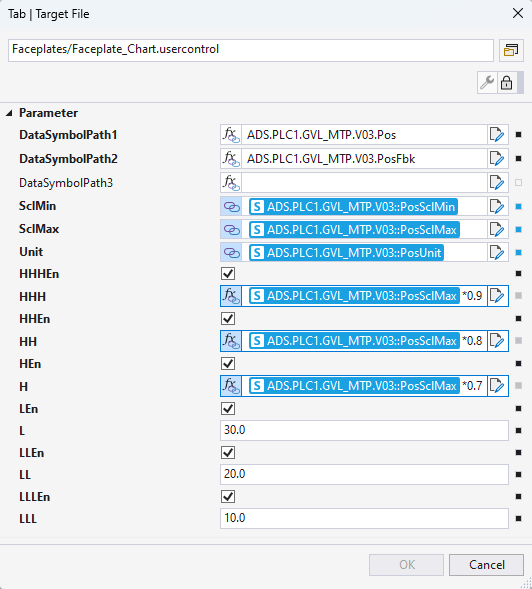
- DataSymbolPath1 … DataSymbolPath3 should be entered (manually, not chosen from the drop-down list) as a path to the PLC variable.
- SclMin, SclMax, Unit and limit values should be linked as symbols or entered as JavaScript expressions.
The result of the configuration is shown below: