Basic function principles
The thermocouple terminals can evaluate thermocouples of the types B, E, J, K, L, N, R, S, T and U. The characteristic curves are linearized and the reference temperature determined directly within the terminal. Temperatures are output in 1/10°C, for example (device-dependent). The terminal is fully configurable via the Bus Coupler or the control system. Different output formats may be selected or own scaling activated. In addition, linearization of the characteristic curve and determination and calculation of the reference temperature (temperature at the terminal connection contacts) can be switched off.
Measuring principle of the thermocouple
Thermocouples can be classified as active transducers. They exploit the thermo-electric effect (Seebeck, Peltier, Thomson). A voltage referred to as thermovoltage occurs over the length of a cable with different temperatures at both ends. It is an unambiguous function of the temperature and the material. In a “TC element” this effect is utilized by operating two different conductor materials in parallel (s. fig.)
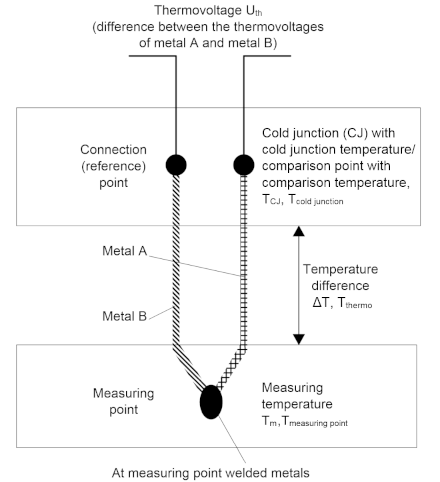
Example:
In the following example, the voltage Uth is given which is present at a type-K thermocouple at the temperature Tm.
Uth = (kNiCr - kNi) x ΔT
with
ΔT = Tm - Tv
A type-K thermocouple consists of a junction of a nickel-chrome alloy and nickel, where kNiCr and kNi represent the thermoelectric coefficients of nickel-chrome and nickel respectively. By adapting the equation according to Tm, the sought-after temperature can be calculated from the voltage measured across the thermocouple. Based on the difference to the cold junction temperature, the temperature at the measurement point can be determined to an accuracy of better than one tenth of a Kelvin with the aid of the above thermocouple equation.
 | Sensor circuit A modification of the sensor circuit with additional devices such as change over switches or multiplexer decreases the measure accuracy. We strongly advise against such modifications. |
Internal conversion of the thermovoltage and the reference voltage
Since the coefficients are determined at a reference temperature of 0°C, it is necessary to compensate for the effect of the reference temperature. This is done by converting the reference temperature into a reference voltage that depends on the type of thermocouple, and adding this to the measured thermovoltage. The temperature is found from the resulting voltage and the corresponding characteristic curve.
Uk = Um+ Ur
Tout = f(Uk)
The four LEDs indicate the operating state of the associated terminal channels.
- green Run LEDs: RUN (not applicable for KL3314)
- On: normal operation
- Off: Watchdog timer overflow has occurred. If no process data are transmitted by the Bus Coupler for 100 ms, the green LEDs go out.
- Red LEDs: ERROR
- On: Wire breakage. The resistance is in the invalid range of the characteristic curve of the respective thermocouple.
- Off: The resistance is in the valid range of the characteristic curve.
Process data output format
In the delivery state, the measured value is displayed in increments of 1/10 °C in two's complement format (integer). Other presentation types can be selected via the feature register (R32) (e.g. signed amount representation, Siemens output format).
Measured value | Output | |
|---|---|---|
Hexadecimal output | Signed integer output | |
-200.0 °C | 0xF830 | -2000 |
100.0°C | 0xFC18 | -1000 |
0.1°C | 0xFFFF | -1 |
0.0°C | 0x0000 | 0 |
0.1°C | 0x0001 | 1 |
100.0°C | 0x03E8 | 1000 |
200.0°C | 0x07D0 | 2000 |
500.0°C | 0x1388 | 5000 |
850.0°C | 0x2134 | 8500 |
1,000.0°C | 0x2710 | 10000 |
Voltage limits
- Uk > Ukmax:
Bits 1 and 6 (overrange and error bits) in the status byte are set. The linearization of the characteristic curve is continued with the coefficients of the overrange limit up to the limit stop of the A/D converter or to the maximum value of 0x7FFF. - Uk < Ukmin:
Bits 0 and 6 (underrange and error bits) in the status byte are set. The linearization of the characteristic curve is continued with the coefficients of the underrange limit up to the limit stop of the A/D converter or to the minimum value of 0x8000.
For overrange or underrange the red error LED is switched on.
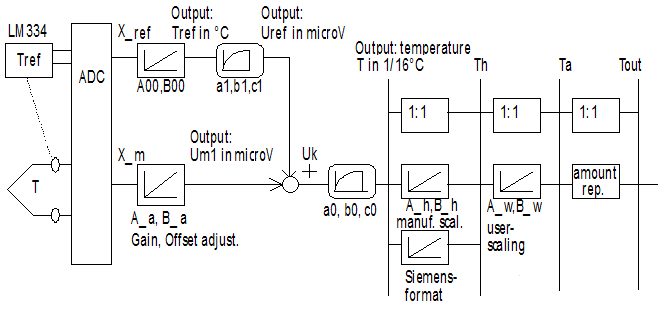
Calculation of process data
The process data that are transferred to the Bus Coupler are calculated using the following equations:
Tref = A00 * X_ref Uref = a1 * Tref2 + b1 * Tref + c1 | (1.0) (1.1) | Voltage value of the cold junction |
Um1 = A_a * X_ X_m + B_a Uk = Uref + Um1 T = a0 * Uk2 + b0 * Uk + c0 | (1.2) (1.3) (1.4) | Measured temperature in 1/16°C
|
Tout = T | (1.5) | Neither user nor manufacturer scaling is active |
Th = A_h * T + B_h Tout = Th | (1.6) | Manufacturer scaling active (factory setting) |
Ta = A_w * T + B_w Tout = Ta | (1.7) | User scaling active |
Th = A_h * T + B_h Ta = A_w * T + B_w Tout = Ta | (1.7) | Manufacturer and user scaling active |
Key
Name | Name | Register |
|---|---|---|
X_ref | Output value of the A/D converter |
|
Tref | Temperature of the cold junction |
|
Uref | Voltage value of the cold junction |
|
X_m | ADC value of the temperature sensor |
|
Um1 | Voltage value of the temperature sensor |
|
A_a | Vendor calibration: Gain | R17 |
B_a | Vendor calibration: Offset | R18 |
A_h | Manufacturer scaling: Gain | R20 |
B_h | Manufacturer scaling: Offset | R19 |
A_w | User scaling: Gain | R34 |
B_w | User scaling: Offset | R33 |
Uk | Sum of Uref and Um1 |
|
T | Measured temperature in 1/16°C |
|
Th | Temperature after vendor scaling (1/10 °C) |
|
Ta | Temperature after user scaling |
|
Tout | Process data to PLC |
|
The equations of the straight line are enabled via register R32