Pick-and-place application
The following sample shows an analysis of an XTS application together with a pick-and-place robot. It offers you two options:
- You can use the sample data and build your own TwinCAT Analytics project.
- You can use the ready-to-use TwinCAT Analytics project in order to understand how TwinCAT Analytics works.
In both cases, it makes sense to understand the machine application that provides the data for the analysis. The application sequence is shown in the video:
Application description
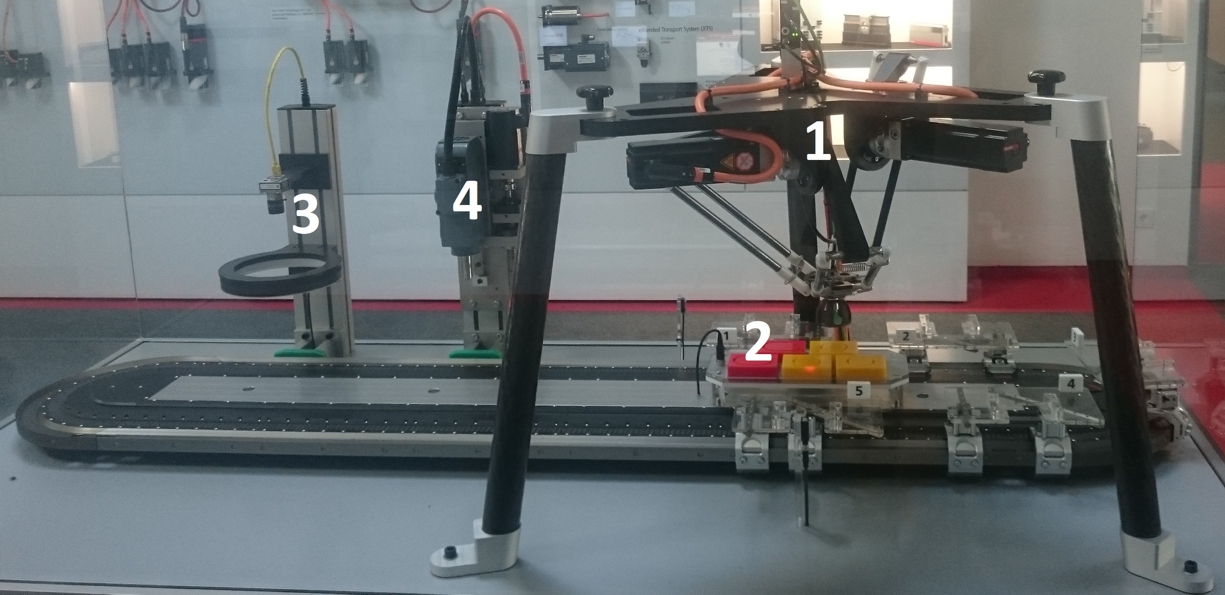
This application example describes a simulation for the processing of production goods. The application transports workpieces from a store to a drill via a Beckhoff XTS system. Depending on the color of the workpiece, a different pattern is milled into each part. The XTS system shown has a length of 4000 mm. It includes ten movers, with two movers together carrying one tray. A pick-and-place robot (1) is positioned at the workpiece store (2). Two red and three yellow parts are located in five store positions, which the picker can pick up or set down via a vacuum pump. On the opposite side of the XTS there is a vision system (3) for identifying the workpiece color and a miller (4) for the specific milling contour.
The trays drive to the workpiece store. The picker picks up the parts and loads or unloads the trays. The tray then drives to the scanner, where the color of the workpiece is scanned and communicated to the downstream miller. Depending on the color, the workpieces are processed differently: a circle is milled into yellow parts, and an oval shape is milled into red parts. The workpiece then drives back to the store and is stored there by the picker. The tray is loaded with another part and drives onwards.
Variable description
The following variables are recorded by the TwinCAT Analytics Logger in the attached Analytics File Format. You can use the data for your own Analytics configurator project or for the default configuration in the tnzip file provided. The meaning and function of each variable are shown in the following table.
Variable name | Data Type | Description |
|---|---|---|
bMillerMilling | BOOL | Information about the activity of the drill: 1 if the drill is active and 0 if the drill is inactive. |
bMillerMovingZ | BOOL | Information about the movement of the drill in z-direction: is 1 if the drill moves in z-direction and 0 if it does not move in z-direction. |
bMillerSpindleRotation | BOOL | Information about the activity of the drill needle: is 1 when the needle is moving and the drill is active, and 0 when it is not moving. |
bNewWorkpieceColorScanned | BOOL | Registers if a new color has been scanned (= 1), and then will inform the drill. If the color is changing the drill pattern has to be changed. When the color is still the same (=0) the drill pattern will not change. |
bPickerHoldingWorkpiece | BOOL | Is 1, when the picker is holding a workpiece and 0, when not. |
bPickerInStorage1Position | BOOL | Is 1, when the picker is in storage position 1. |
bPickerInStorage2Position | BOOL | Is 1, when the picker is in storage position 2. |
bPickerInStorage3Position | BOOL | Is 1, when the picker is in storage position 3. |
bPickerInStorage4Position | BOOL | Is 1, when the picker is in storage position 4. |
bPickerInStorage5Position | BOOL | Is 1, when the picker is in storage position 5. |
bPickerInXtsPosition | BOOL | Is 1, when the picker is XTS position, which means over the XTS. |
bPickerMoving | BOOL | Information, when the picker is |
fMillerPositionZ | LREAL | Indicates the z-position of the drill. At a value of 224 the drill is in drill position, at 245 he is inactive. |
fMillerSpindleRotation | LREAL | Indicates the amount of revolutions per minute of the drill needle. |
nColorOfLastScannedWorkpiece | INT | Registers the color of the last scanned workpiece. 5 → yellow workpiece 4 → red workpiece |
nCurrentProductionTime | ULINT (64-bit) | Registers the current production time. |
nVacuumPressure | DINT | The picker grasps the workpieces via compressed air. This variable indicates the current pressure in mbar. |
stMachineVibrations aMachineVibrations[1...10] | STRUCT with ARRAY of LREAL | The structure stMachine Vibrations indicates the vibrations of the machine base in the unit m/s2 with oversampling. |
stPickerPosition aPickerPosition[1...3] | STRUCT with ARRAY of LREAL | The structure stPickerPosition contains an array with three values. The values indicate the x-/y- and z-position of the picker. |
stTableInMillingPosition aTableInMillingPosition[1...5] | STRUCT with ARRAY of BOOL | The stTableInMillingPosition structure contains an array with five values, each of which represents a tray: value 1 for tray 1, value 2 for tray 2... if the value is 1, the tray is in the drill position. |
stTableInStoragePosition aTableInStoragePosition[1...5] | STRUCT with ARRAY of BOOL | The stTableInStoragePosition structure contains an array with five values, each of which represents a tray: value 1 for tray 1, value 2 for tray 2... if the value is 1, the tray is in the workpiece store. |
stWorkpieceColors aWorkpieceColors[1...5] | STRUCT with ARRAY of INT | The structure stWorkpieceColors contains an array with five values, each value stands for one workpiece and indicates its color (as Int value): Workpiece 1: yellow Workpiece 2: yellow Workpiece 3: red Workpiece 4: red Workpiece 5: yellow |
stWorkpiecePositions aWorkpiecePosition[1...5] | STRUCT with ARRAY of INT | The structure stWorkpiecePositions contains an array with five values for each workpiece. The Int value indicates the current position of the workpiece: 1: storage 1 2: storage 2 3: storage 3 4: storage 4 5: storage 5 6: tray 1 7: tray 2 8: tray 3 9: tray 4 10: tray 5 11: picker |
stXtsMoverAcceleration aXtsMoverAcceleration[1...10] | STRUCT with ARRAY of LREAL | The structure stXtsMoverAcceleration contains an array with ten values for the movers 1-10 and indicates the acceleration of the particular mover. |
stXtsMoverMovingNegative aXtsMoverMovingNegative[1...10] | STRUCT with ARRAY of BOOL | The structure stXtsMoverMovingNegative contains an array with ten values for the movers 1-10 and is 1, when the particular mover is moving backward. |
stXtsMoverMovingPositive aXtsMoverMovingPositive [1...10] | STRUCT with ARRAY of BOOL | The structure stXtsMoverMovingPositive contains an array with ten values for the movers 1-10 and is 1, when the particular mover is moving forward. |
stXtsMoverPositionsX aXtsMoverPositionsX[1...10] | STRUCT with ARRAY of LREAL | The structure stXtsMoverPositionsX contains an array with ten values for movers 1-10. The value indicates the x-position of the respective mover on the XTS. |
stXtsMoverVelocity aXtsMoverVelocity[1...10] | STRUCT with ARRAY of LREAL | The structure stXtsMoverAcceleration contains an array with ten values for the movers 1-10 and indicates the velocity of the particular mover. |
How to get the data
In the download area you will find a 30-minute recording of the XTS system that can be used for further analysis. To access these data, you must make the data available in a historical stream using the Analytics Storage Provider. A message broker should be made available for this. For the samples prepared, we assume that all components are running on the local system.
Install the Analytics Storage Provider. Follow the instructions given.
- Import your Analytics file data into the Storage Provider (see: Importing Analytics Files).
- Use the Analytics Storage Provider Configurator to start the Storage Provider Windows service.
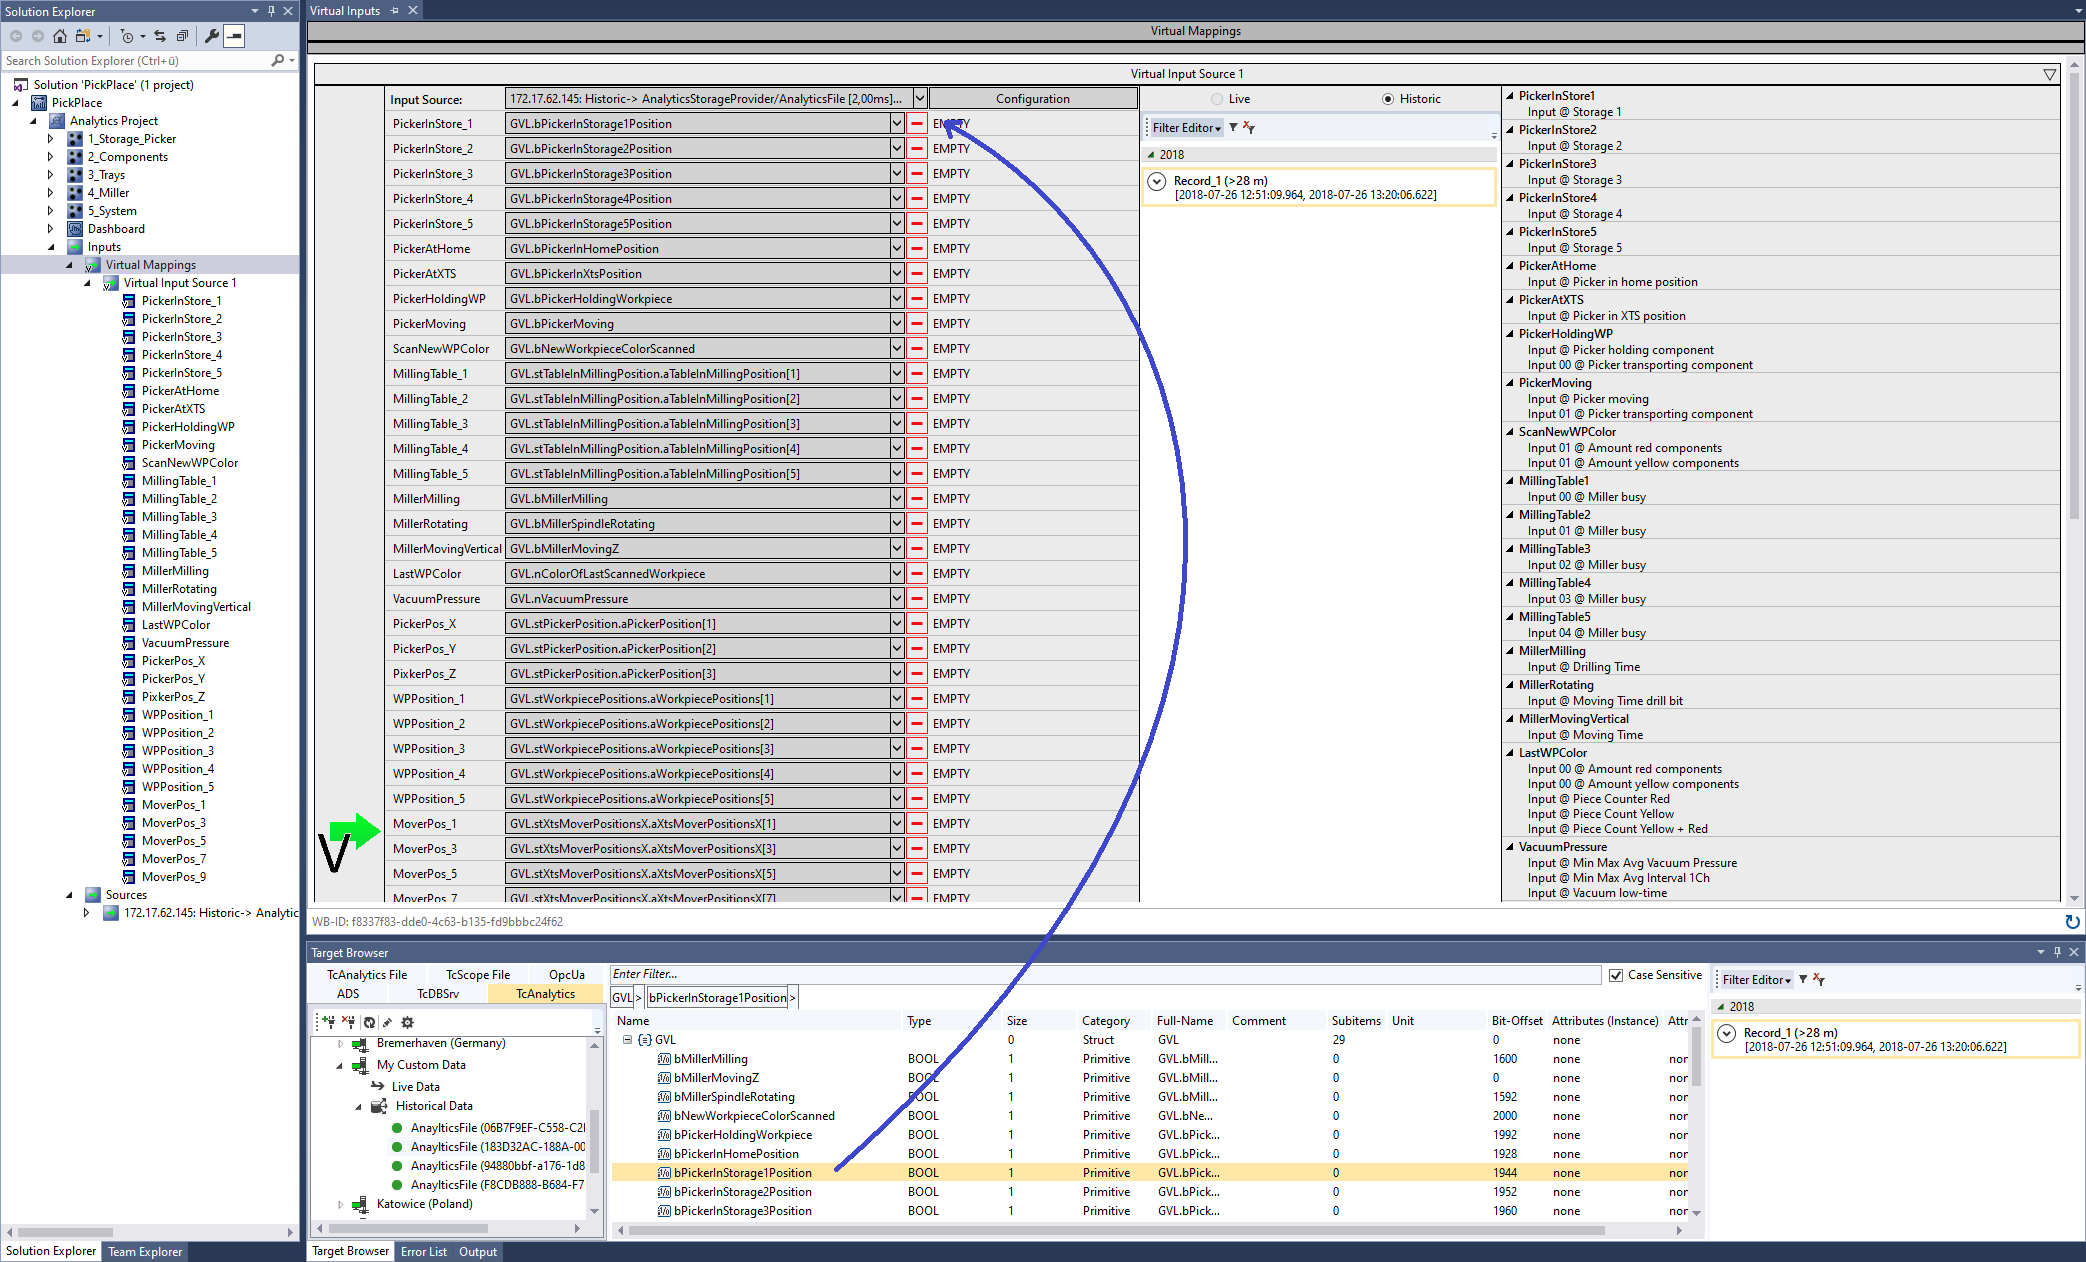
- Open the TwinCAT Target Browser in the TcXaeShell or in Visual Studio®. Select the TcAnalytics tab and your message broker. In the tree on the left-hand side you will now find an entry for the historical data, which will be displayed in the symbol list on the right-hand side when selected.
- Connect individual symbols to the inputs of their Analytics algorithms.
- Start the analysis.
Analysis with the Analytics Workbench
The analysis that is the subject of the TwinCAT Analytics project from the download area is explained below. Download and open the finished project.
Select the Virtual Mappings node and also browse for the topic specified by your storage provider in the Target Browser. Select the data and link them to the appropriate virtual inputs in the editor.
Description of the Analytics project
Network name | Used variables | Used Algorithms | Description |
|---|---|---|---|
1_Storage_Picker | bPickerinStoragePosition, bPickerHoldingWorkpiece, bPickerInXtsPosition, bPickerInHomePosition, bPickerMoving, stPickerPosition | Edge Counter, Math Operation, Edge Counter OnOff, Logic Operation Counter, Numerical Compare, Min Max Avg | Picker: This network analyses the picker actions. It counts the quantities if the picker holds a workpiece, is in starting position or in XTS position. It is also analyzed how often the picker is transporting a workpiece, how often the picker is loading a mover as well as its xyz-position. How often does the picker load a workpiece? Storage: This network analyses the storage use of the five storage positions next to the picker. The quantities and proportions of storage uses are counted. Is each storage used equally? |
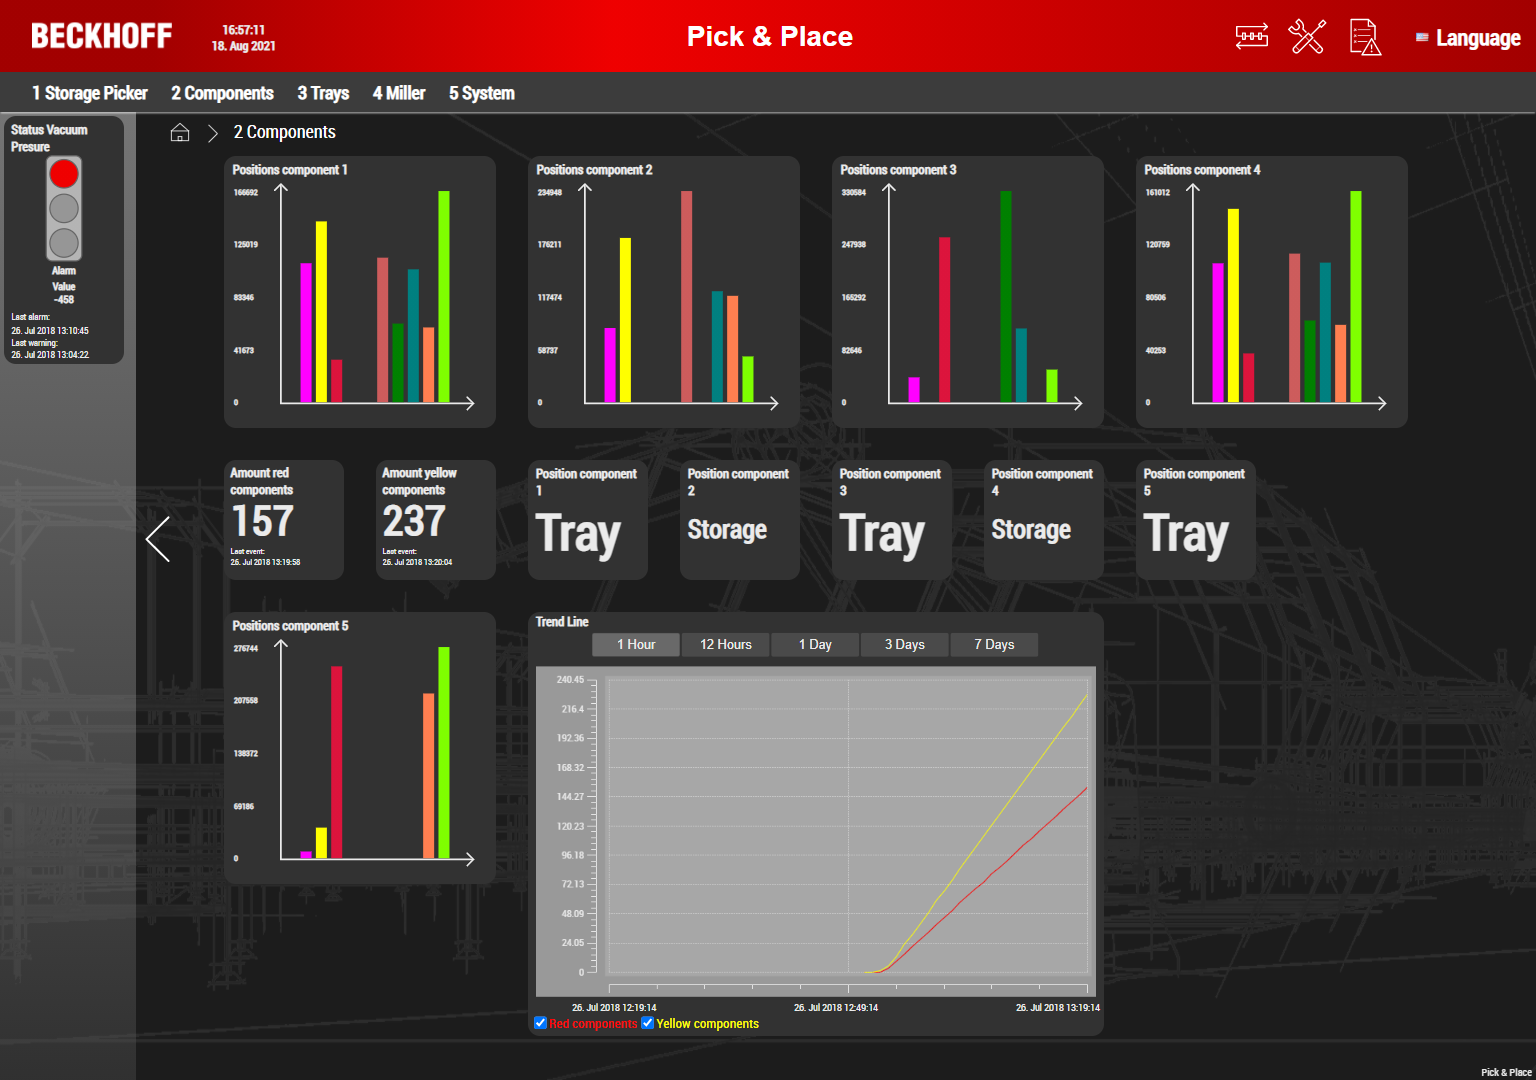
2_Components | bNewWorkpieceColorScanned, bMillerMilling, nColorOfLastScannedWorkpiece, stWorkpiecePosition | Logic Operation Counter, Threshold String Classificator, Histogram, Trend Line | This network analyzes the workpieces themselves. How many workpieces of each color are processed at the scanner and the miller and the current position of each workpiece can be detected. The histogram algorithms show the distribution of the workpiece positions. How many red workpieces were processed? |
3_Mover | stTableInMillingPosition, sXtsMoverPosition
| XTS Velocity Analysis, XTS Distance Integrator, Min Max Avg Interval, Math Operation, Threshold Classificator, Trend Line, Edge Counter, Lifecycle Analysis, Logic Operation Counter
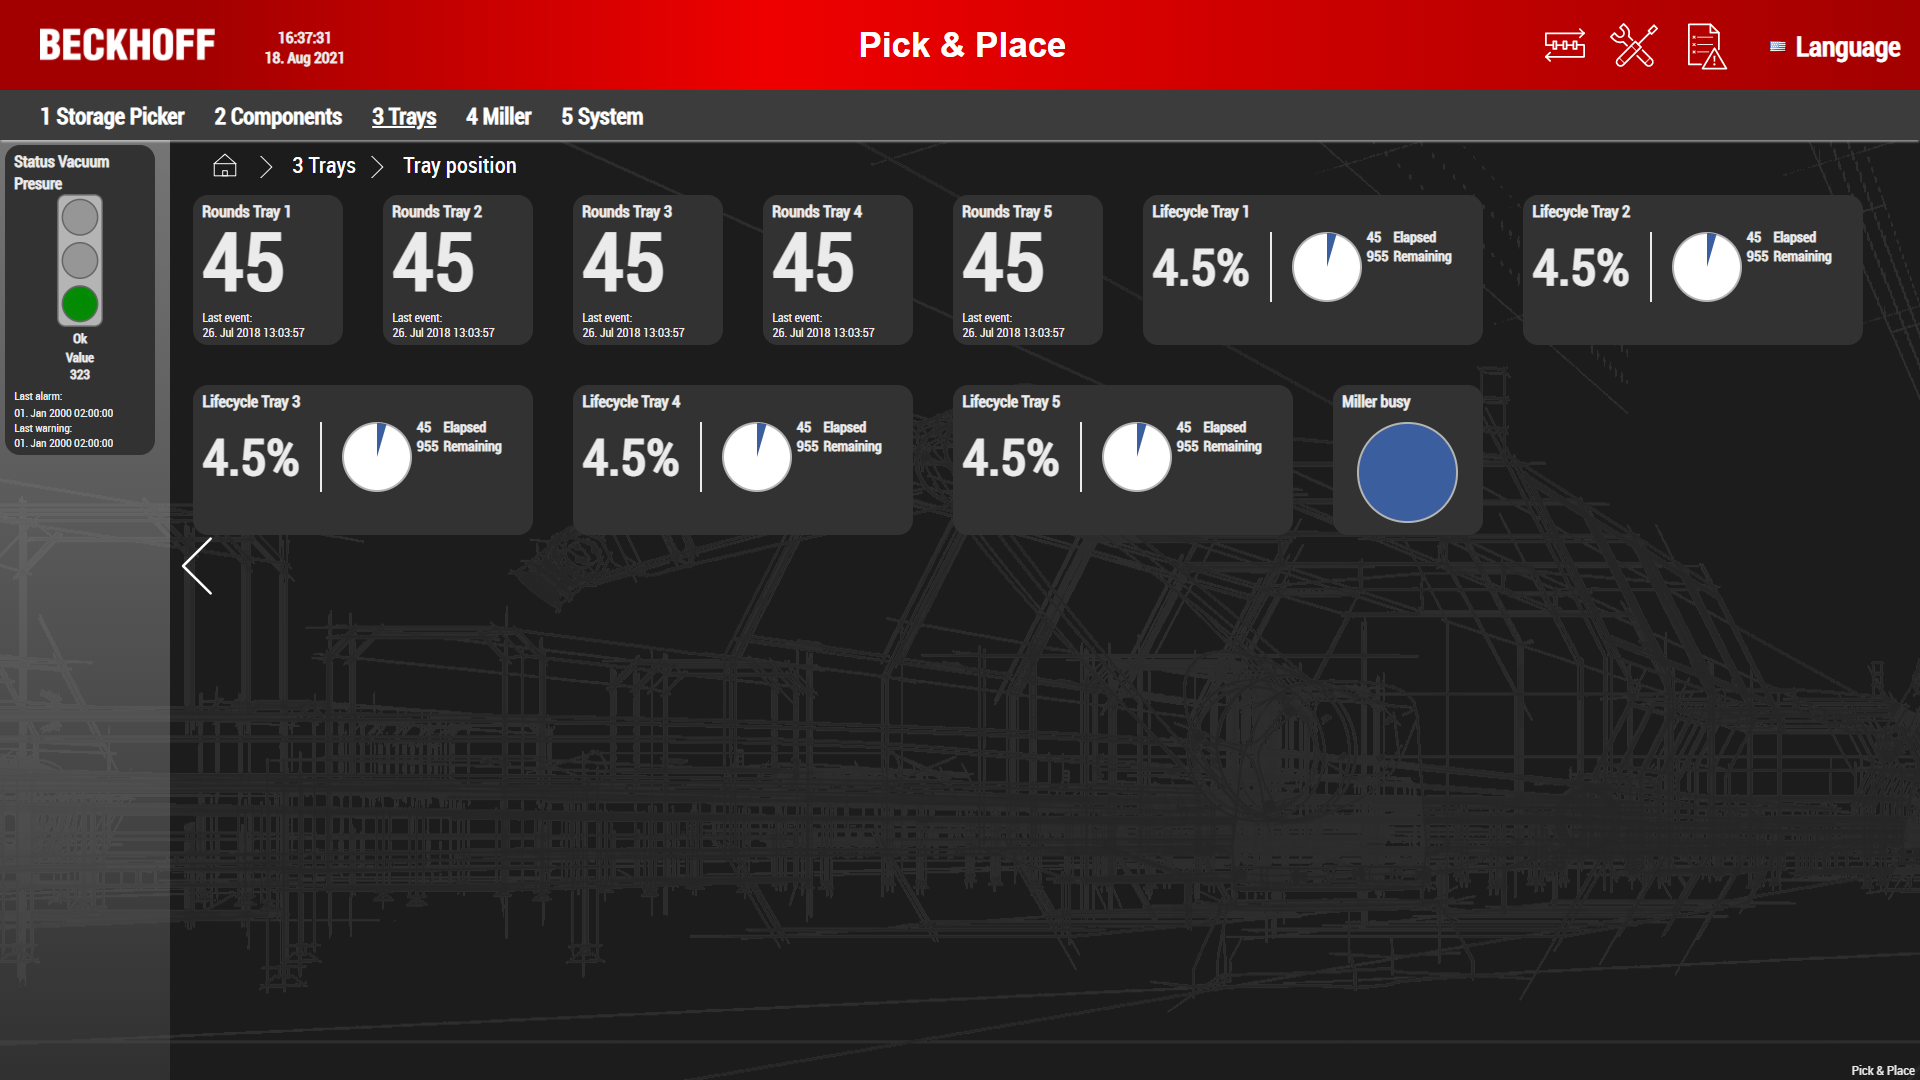
| Distance: This network analyses the distance travelled of each tray and calculates the overall distance of all movers. As the length of the XTS system is known (4000 mm), the average amount of rounds for each tray can be derived. The Threshold Analysis gives a warning after 40 rounds and an alarm after 45 rounds. Which distance did all trays travel in total? Tray position: This network analyses how often the trays are stopping at the storage or at the miller and stops how long it takes a tray to move one round. How often did all trays stop at the miller? Velocity: This network analyses the current velocity of the trays as well as the minimum and maximum velocity in the last 20 seconds. The trays can move backwards. Therefore, the minimum velocity can be negative. What is the maximum velocity you can read? |
4_Miller | bMillerMilling, bMillerSpindleRotating, bPickerMoving | Event Timing Analysis, Lifetime Analysis | This network performs the analysis for the miller. Drilling time: time the miller is active. Drill bit movement time: time during which the drill bit is active. Drill movement time: time during which the drill is active. For which of the three actions did the miller spend the most time? |
5_System | bNewWorkpieceColorScanned, bMillerMilling, nVacuumPressure, stMachineVibrations | Min Max Avg, Min Max Avg Interval, Timing Analysis, Math Operation Lifecycle Analysis, Threshold Classificator, Continuous Piece Counter
| Productivity: The productivity is analyzed by counting the processed workpieces per 20 seconds and comparing it to previous intervals. Based on the maximum count the productivity of the following intervals is derived. What is the maximum number of workpieces in an interval? Technical components: This network analyzes the vacuum pressure of the picker and issues a warning or alarm message when the life cycle of the vacuum suction unit falls below defined threshold values. How long does it take to get a warning? |
PLC code generation and HMI
After completion of the analysis in the Analytics Workbench, you can generate PLC code and an HMI dashboard (see also: 24h Analytics application):
1. Double-clicking the project node opens the overview page. Select deploy Runtime there
2. The Deploy Wizard opens, which guides you step by step. If no individual settings are desired, you can simply proceed.
3. Optional: on the PLC tab, select a CPU core on which the analysis should be executed. An isolated core must be selected for execution in a virtual machine.
4. On the HMI Dashboard tab, enable generation. Adapt the design to suit your taste.
5. After subsequent confirmation via the Deploy button, a new development environment opens. A TwinCAT XAE project and a TwinCAT HMI project are automatically generated.
6. At the end of the generation, a dashboard opens in the browser. You can observe your original networks via the navigation.
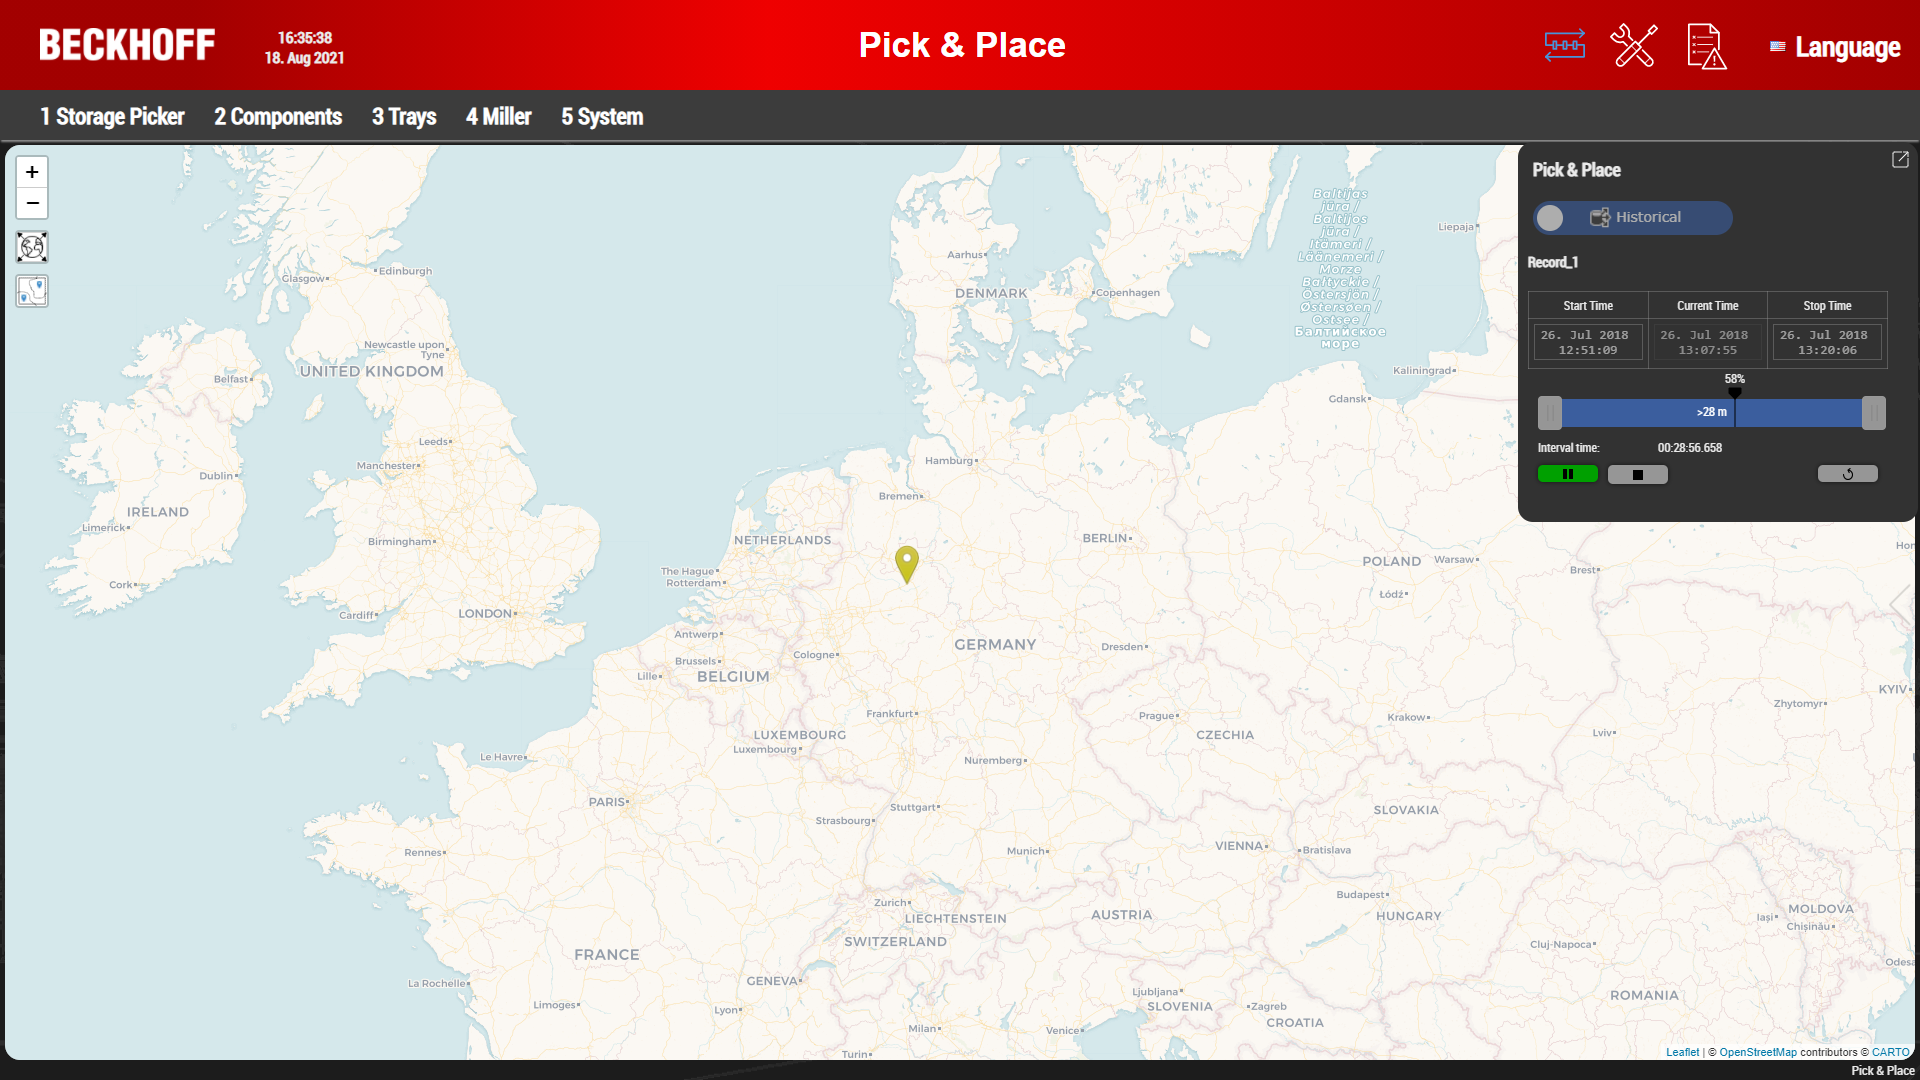
7. You have to start the analysis in order to analyze your historical data. To do this, open the corresponding option element via the third icon from the right at the top.
8. Select the time range of your recorded data that is to be analyzed and start the recording in order to track the analysis results.
Download the finished PLC code generation
If you only want to have a look at a ready generated Analytics PLC project with the corresponding HMI, there is also a download available for this (Sample_Analysis_PickNPlace_PLC). In order for this project to be executable, the main topic and the identification GUID of the storage provider have to be adapted in the code. Appropriate warnings are output, allowing you to navigate conveniently to the appropriate location within TwinCAT, where you will also find indications where the information is available.