24h Analytics application
The last major step in the TwinCAT Analytics workflow is the continuous 24-hour machine analysis. It runs in parallel with the machine applications in the field. To make this very easy, the TwinCAT Analytics Workbench can automatically generate PLC code and an HTML5-based dashboard of your Analytics configuration. Both can be downloaded into a TwinCAT Analytics Runtime (TwinCAT3 PLC and HMI Server) and provide the same analysis results as the configurator tool in the engineering environment.
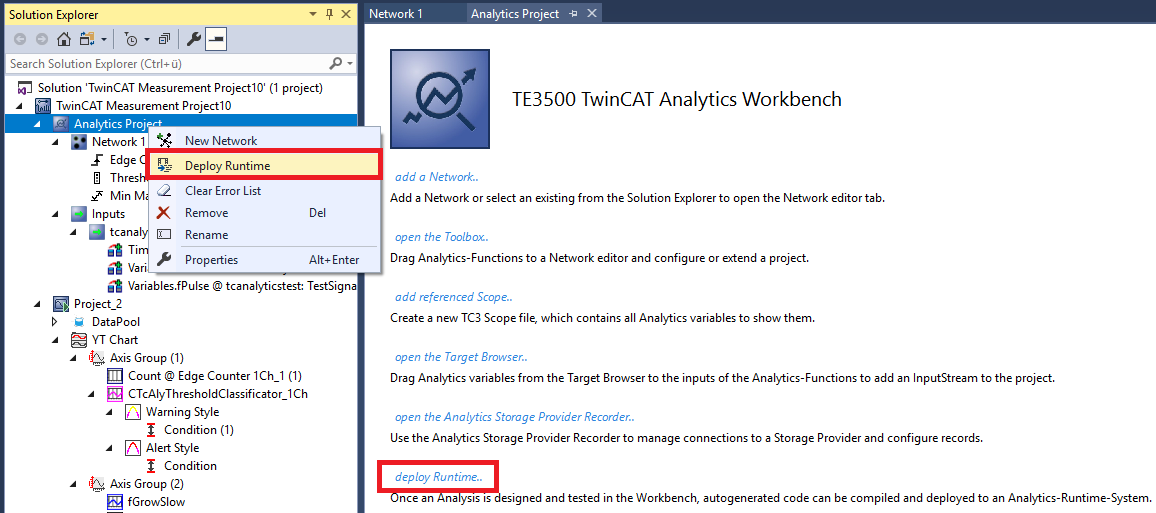
- First, save your configuration and open the Analytics Deploy Runtime Wizard. This can be done from the context menu in the Analytics Project tree item or from the start page.
- 1. When the wizard is open, you can click through some tabs. The first one is called Solution. Here you can decide how your Analytics project should be used in the PLC code: As...
completely new solution.
part of an existing solution.
update of an existing Analytics solution.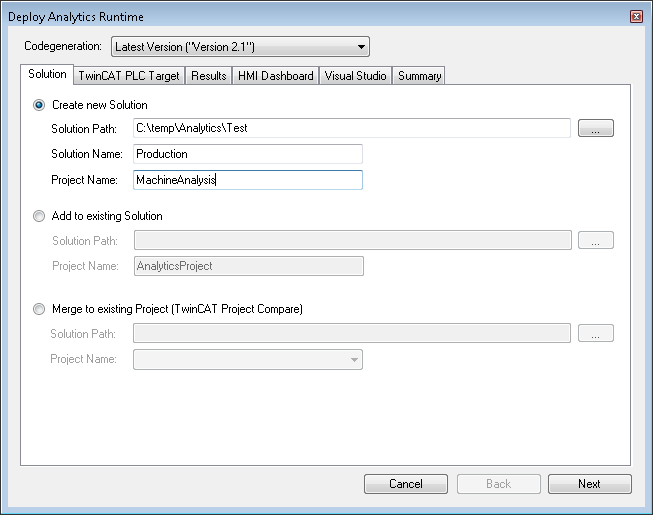
- 2. In the TwinCAT PLC Target tab you can select the ADS target system that runs the TwinCAT Analytics Runtime (TF3550). The created project is immediately executable. For this purpose you can set the Activate PLC Runtime option. In addition, it can be selected that a boot project is created directly.
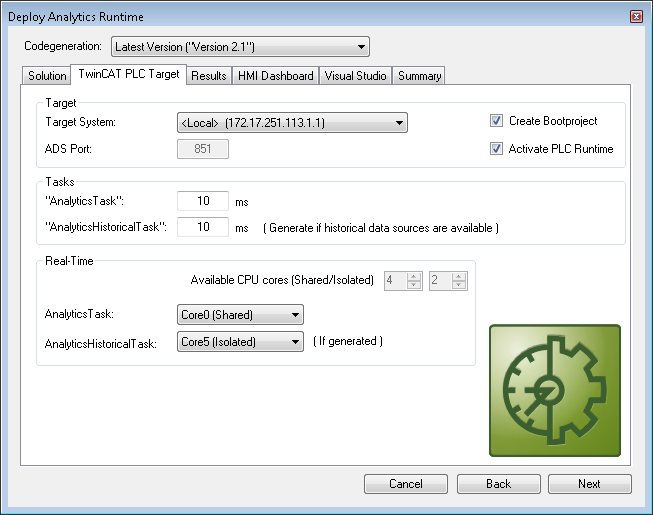
- 3. Especially for virtual machines, it is important to run the project on isolated cores, which is also an option in this tab. The next tab Results is needed only if you have selected the Stream Results option in the algorithm properties. If you want to send results, you can decide here in which way (locally in a file/through MQTT) and which format (binary/JSON) this should be done. This is also generated automatically and executed immediately after activation.
Downsampling of the results is possible by specifying a cycle time.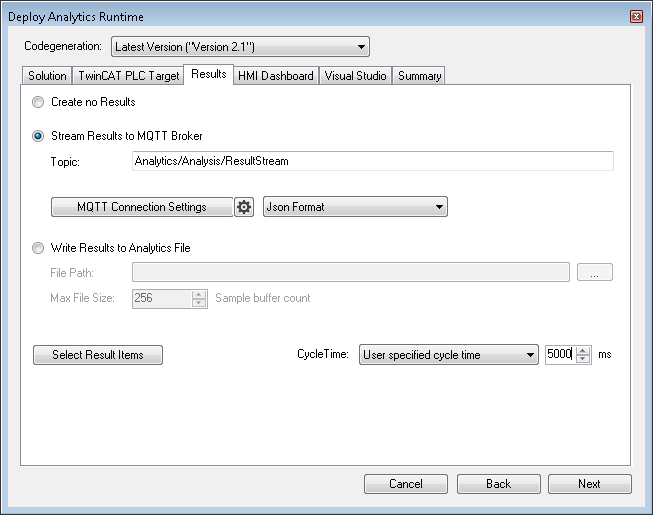
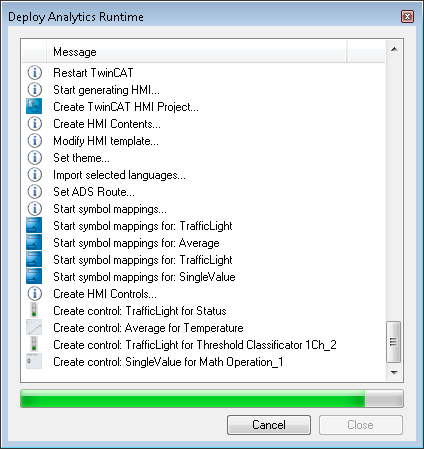
- 4. The next tab is for the HMI Dashboard. A prerequisite for the automatic generation of the dashboard is the selection of HMI Controls for the corresponding algorithms whose results are to be displayed in the dashboard.
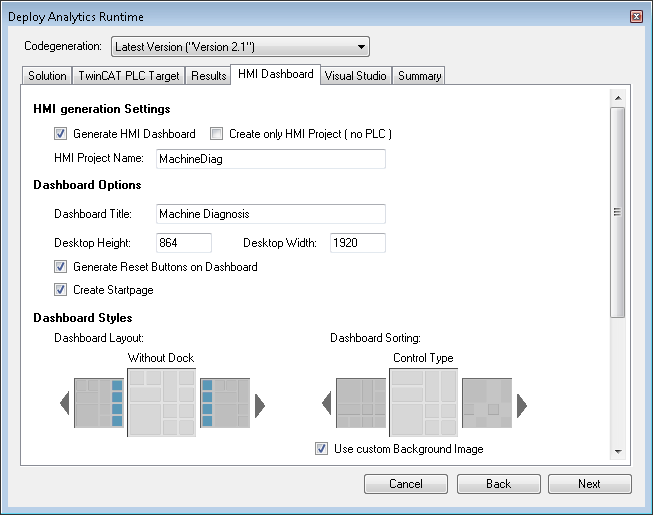
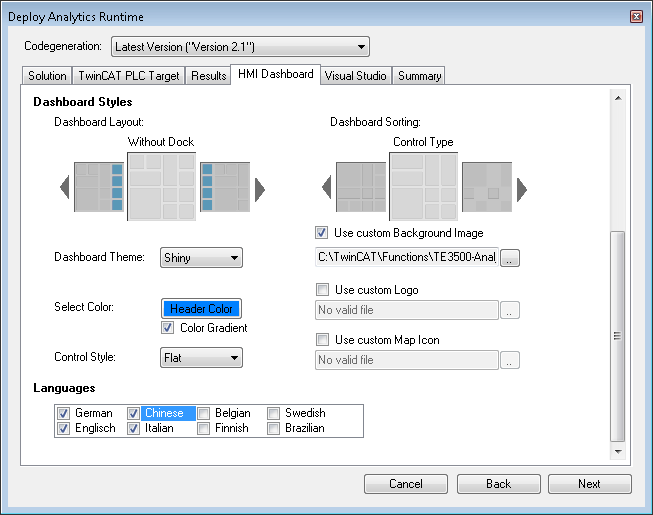
- 5. You can choose different options for your Analytics Dashboard, such as a start page with a map, layouts, sorting algorithms, custom colors and logos. If you select multiple languages for the Analytics Controls, a language switching menu will also be generated.
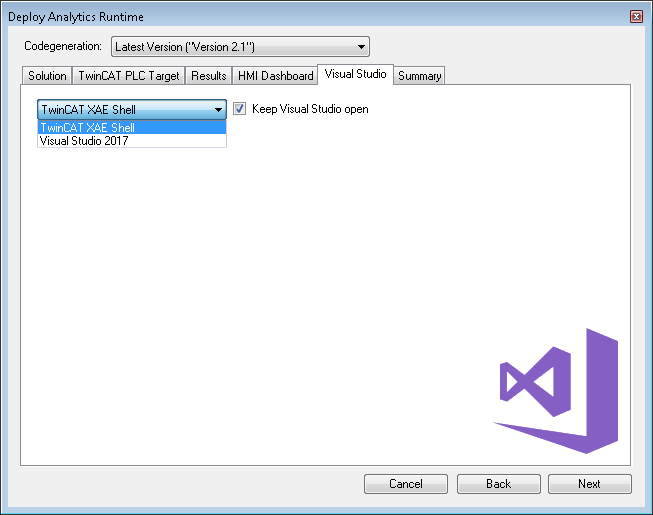
- 6. Select one of the installed versions of Visual Studio and, whether the instance should start visibly or just be set up and activated in the background.
- At last you can find an overview.
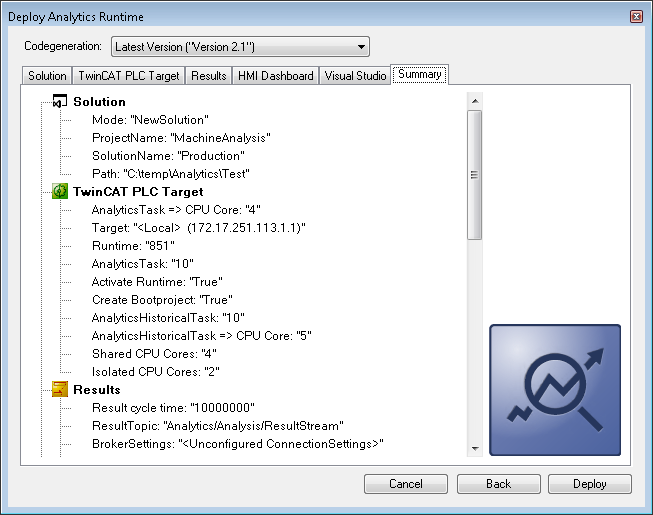
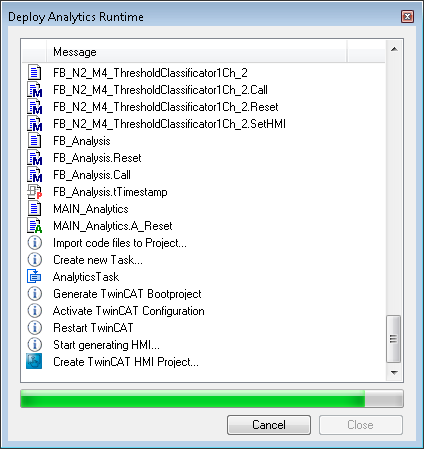
- 7. Now you can click the Deploy button to start the generation process. The PLC project and the HMI dashboard are now generated.
- After the "Deploy Runtime succeeded" message, you will find a new Visual Studio/XAE shell instance on your desktop. The new Solution and both projects are created.