Using markers
Markers allow users to measure Y-axis values at different X-axis positions.
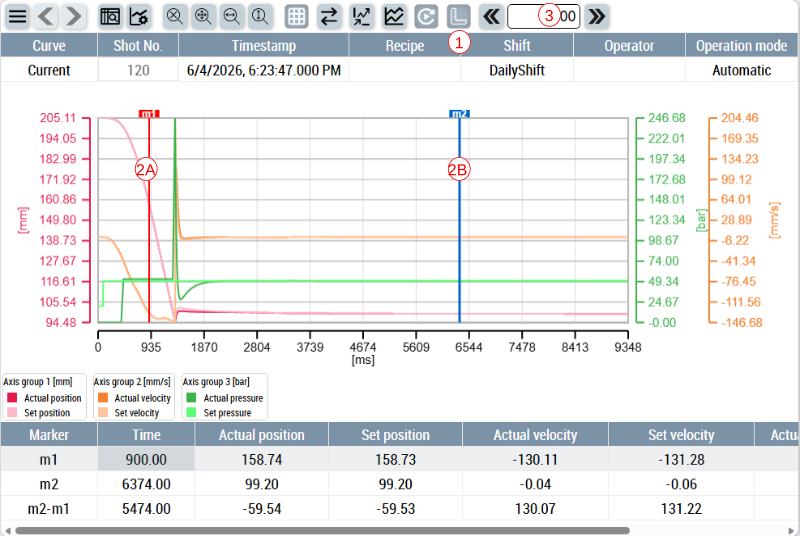
How to use markers:
- Select the marker mode on the menu bar.
- Two markers will appear on the sides of the chart. Drag each marker along the X-axis to mark the required position. The marker table below the chart area will show Y-axis values for each curve and each marker.
- The marker step size input and the shift marker buttons can also be used to move the selected marker to a precise position along the X-axis.