Configure curve display
Users with ‘Configure’ access right can start this dialog from the menu bar. On this dialog the user can configure up to 5 Y-axis groups.
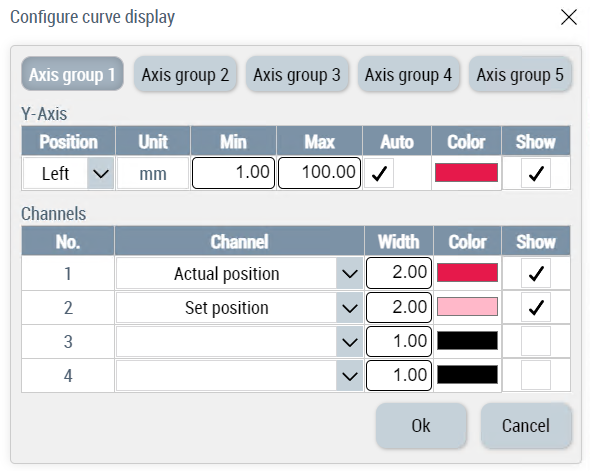
Each axis group has one Y-axis to configure.
A Y-axis can have the below settings:
- Axis position this can be either ‘Left’ or ‘Right’
- Unit text.
- Minimum value.
- Maximum value.
- Auto scale.
- Color of axis.
- Show or hide axis.
Every axis group can have up to 4 curves.
Every curve can be configured with the following settings:
- Scope channel of the curve. This list of possible channels is populated from .scopeex file that is configured in FB_ShotScope function block in PLC.
- Line width of each curve.
- Color of each curve.
- Show or hide the curve.