Marker table
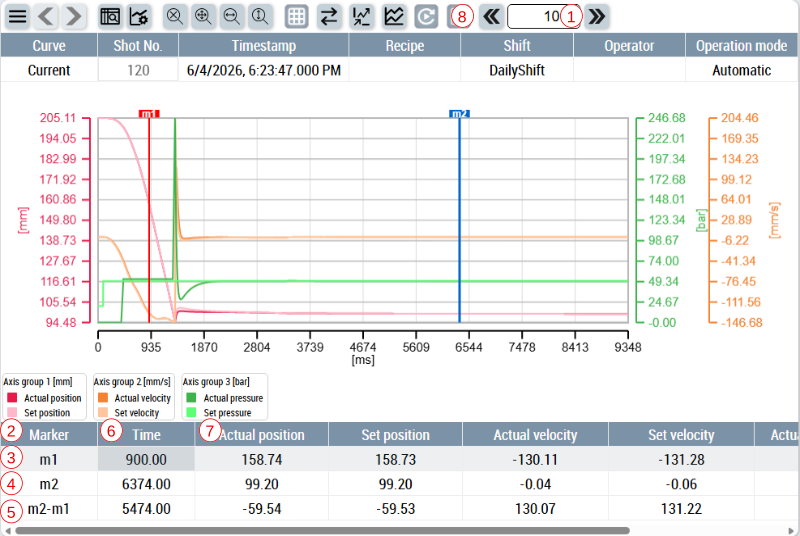
The marker table shows the marker data when the marker mode is active.
In marker mode different objects on the ShotScope control are available.
- Buttons to shift selected marker on the time axis.
- Marker table.
- Table row showing data related to marker m1.
- Table row showing data related to marker m2.
- Table row showing differences for all values between m1 and m2.
- X-axis values for each marker.
- Y-axis values for every curve displayed on the chart for each marker.
- Size that defines how much the selected marker will shift on the time axis in positive or negative direction.