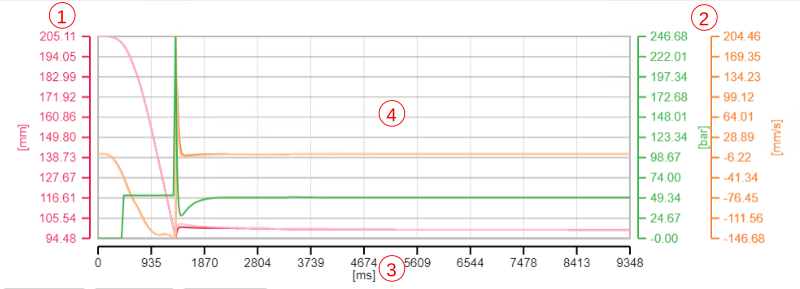
ChartChart component will show the curves as per scope configuration.Y-axes on left side of chart.Y-axes on right side of chart.Time axis.Chart area.