User Interactions
Name | Description | Result on the control |
|---|---|---|
Double tap | Once double tapped on the curve, a new fixed point will be added. A call to ActivateConfig function is required to store this change into configuration. |
|
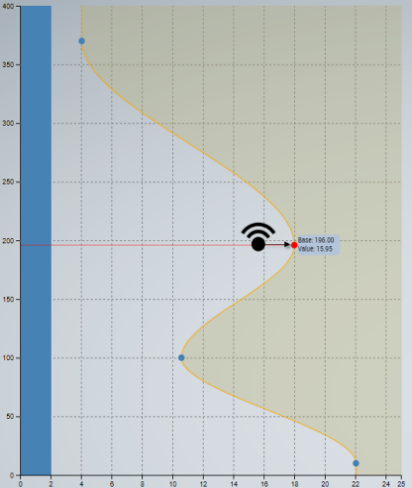
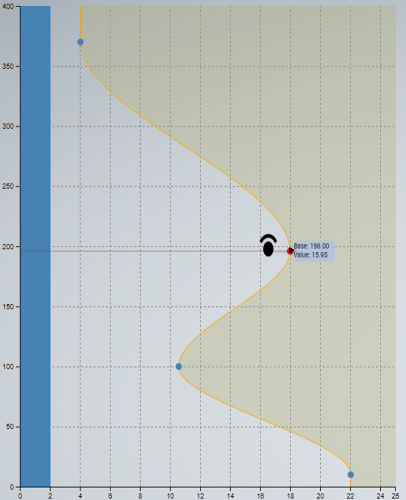
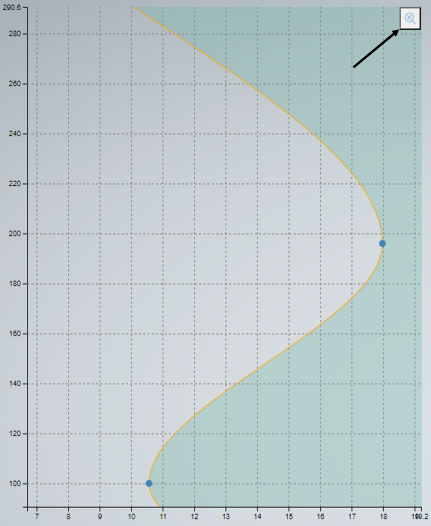
Single tap | With a single tap/click on a fixed point, the cursor points to selected fixed point. A tool-tip will appear to exact values of the cursor. |
|
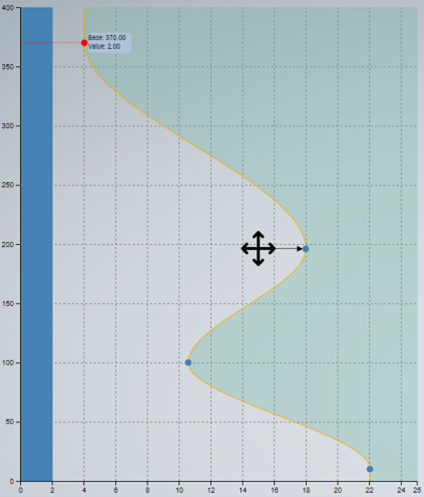
Drag a fixed point | Once a single fixed point is selected, it can be dragged within the curve area. |
|
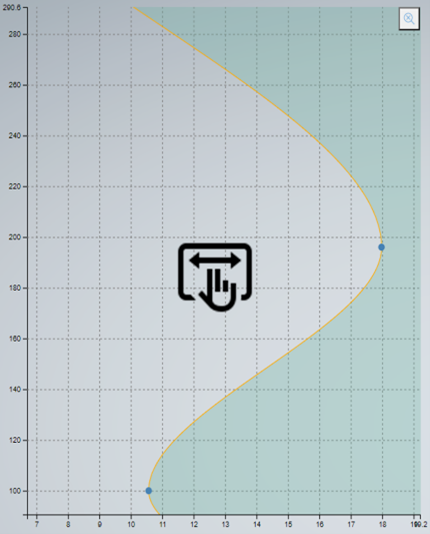
2-finger zoom | Use a two finger pinch gesture to zoom in any part of the curve. |
|
Zoom to selected area. | Three zoom modes can be selected to zoom into a section of curve.
|
|
Zoom reset. | When the curve is zoomed in, a zoom reset button will appear in the top right corner. Clicking this button will zoom the curve back to its default full view. |
|
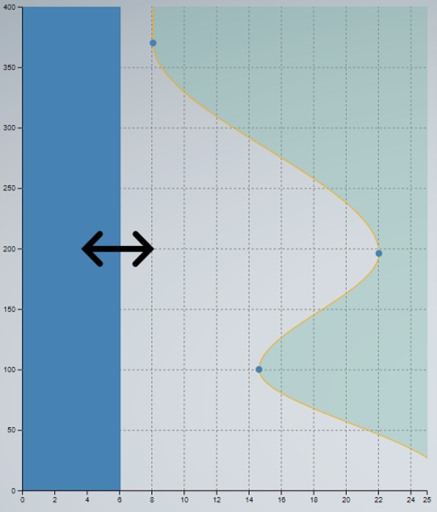
Base component bar dragging | The base component bar can be dragged along the value axis. The base component will change accordingly and be added to all fixed points. |
|