System
Global functions can be activated here and settings can be made that affect the entire system.
Functions:
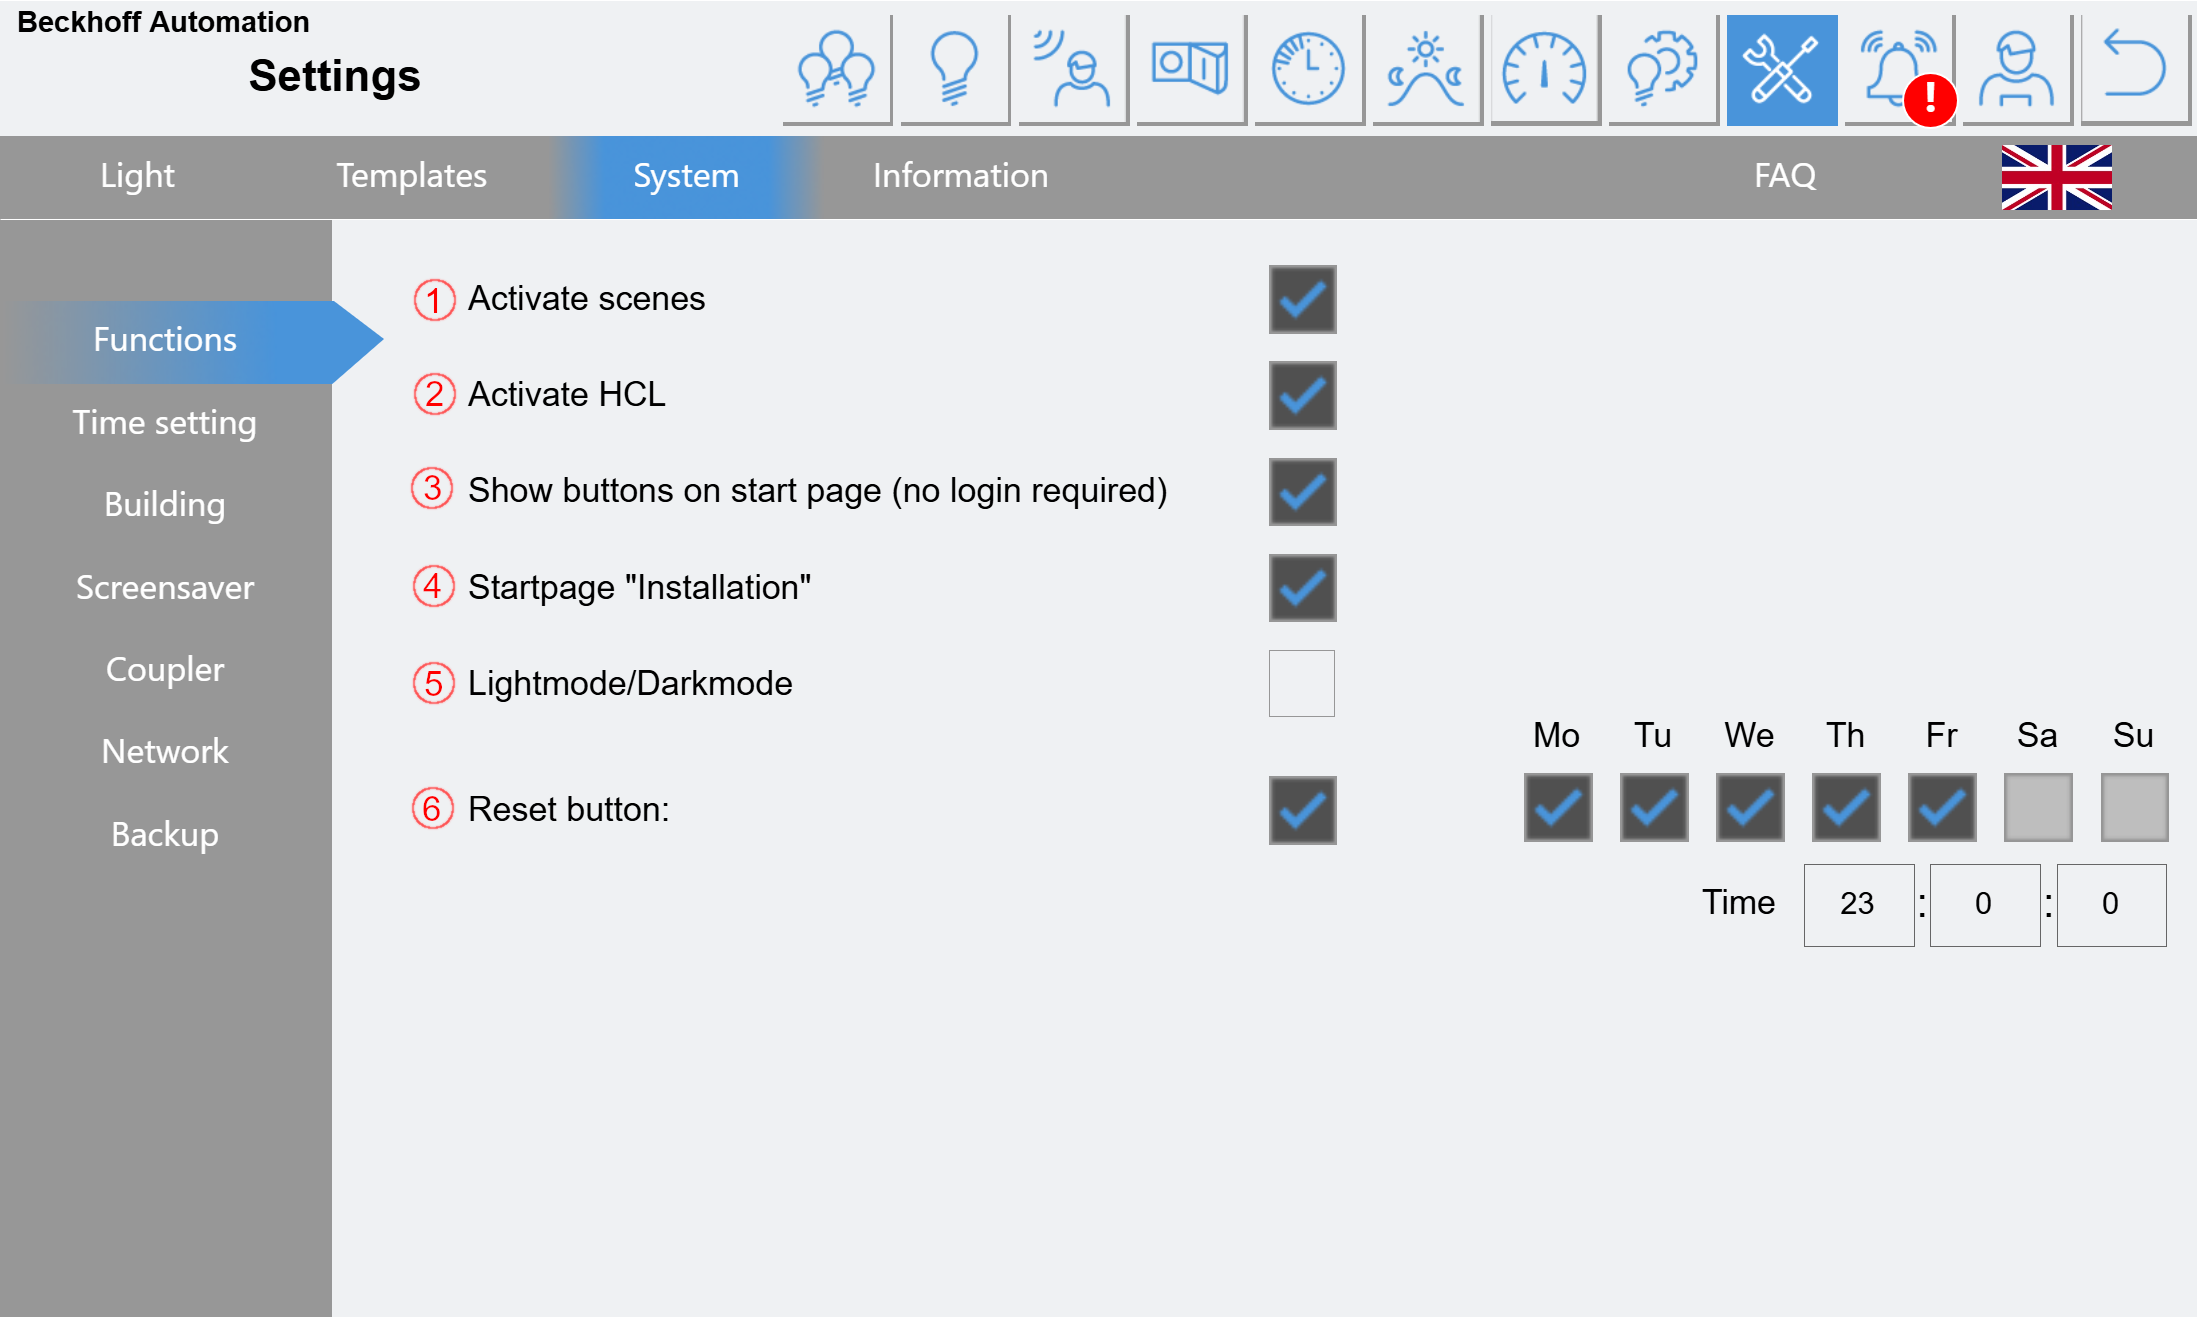
(1) If this function is activated, the button for the scene settings is displayed on the start page.
(2) The HCL function can be activated/deactivated globally here.
(3) If this function is activated, the button for the buttons is displayed on the start page.
(4) Function is activated on delivery and should be deactivated after construction, as the corresponding page allows access to the DALI lines without access rights.
(5) Here you can switch between light and dark display mode.
(6) This function resets all buttons at the specified time and the corresponding illumination switches off.
Time setting:
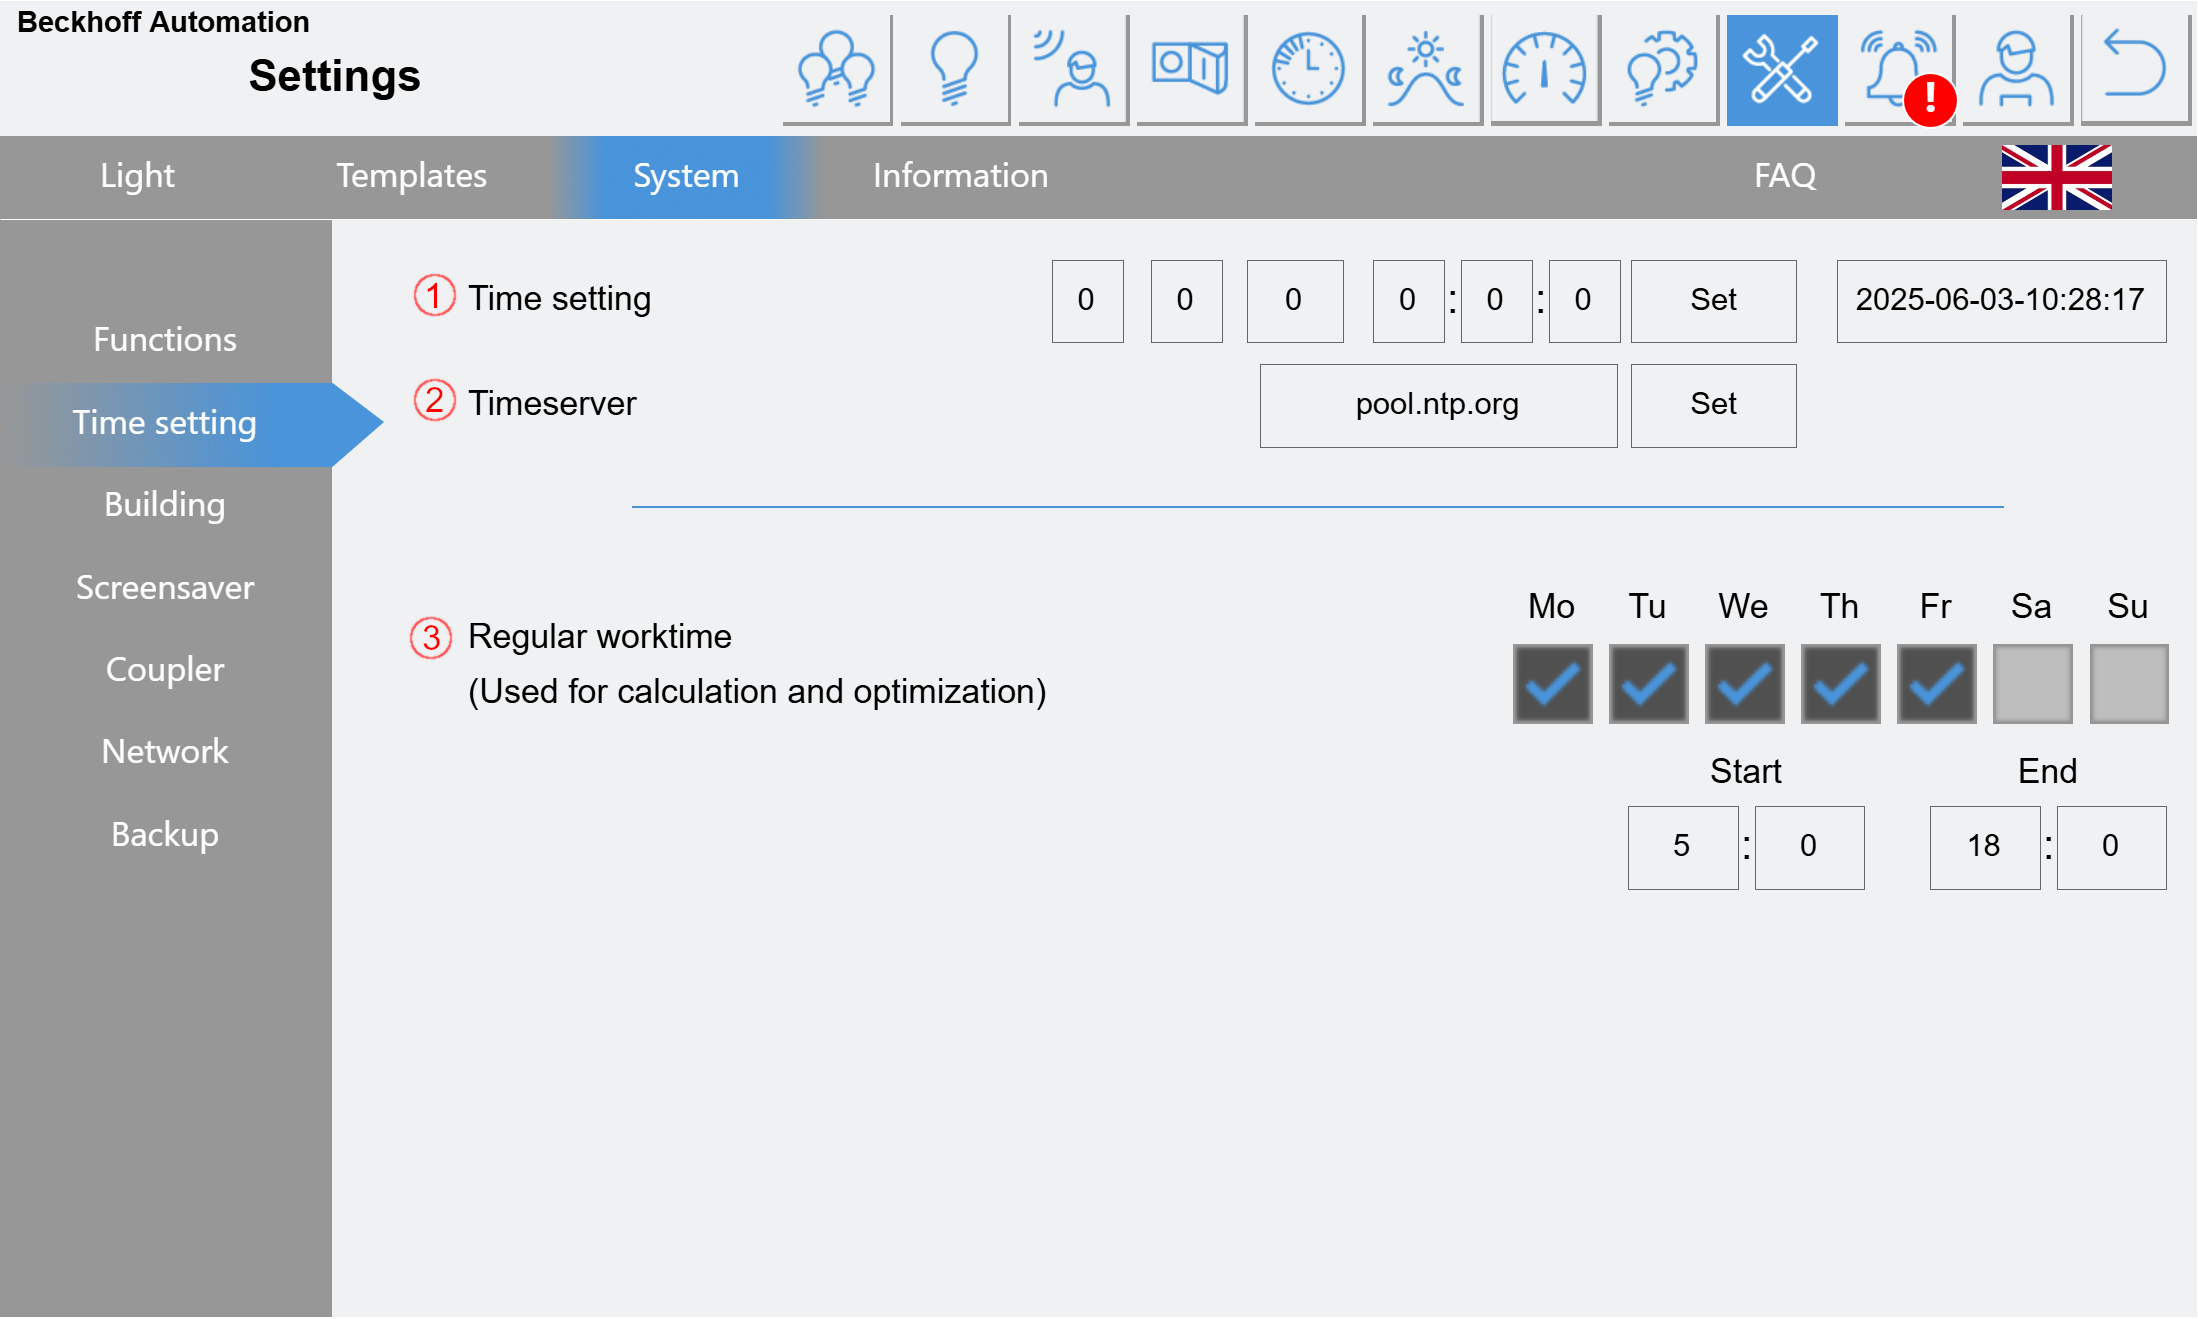
(1) The date and time of the controller can be adjusted here.
Both the date and the time must be entered and confirmed with Set.
(2) A time server can be specified to synchronize the time automatically. When changing, confirm with Set.
(3) The specification of a regular working time is mandatory for some functions. The time set here is used, for example, to calculate average usage values and to report possible false triggering of the sensors.
The timespan should be set slightly longer than the regular business hours. (e.g. ±30-60 min)
Building:
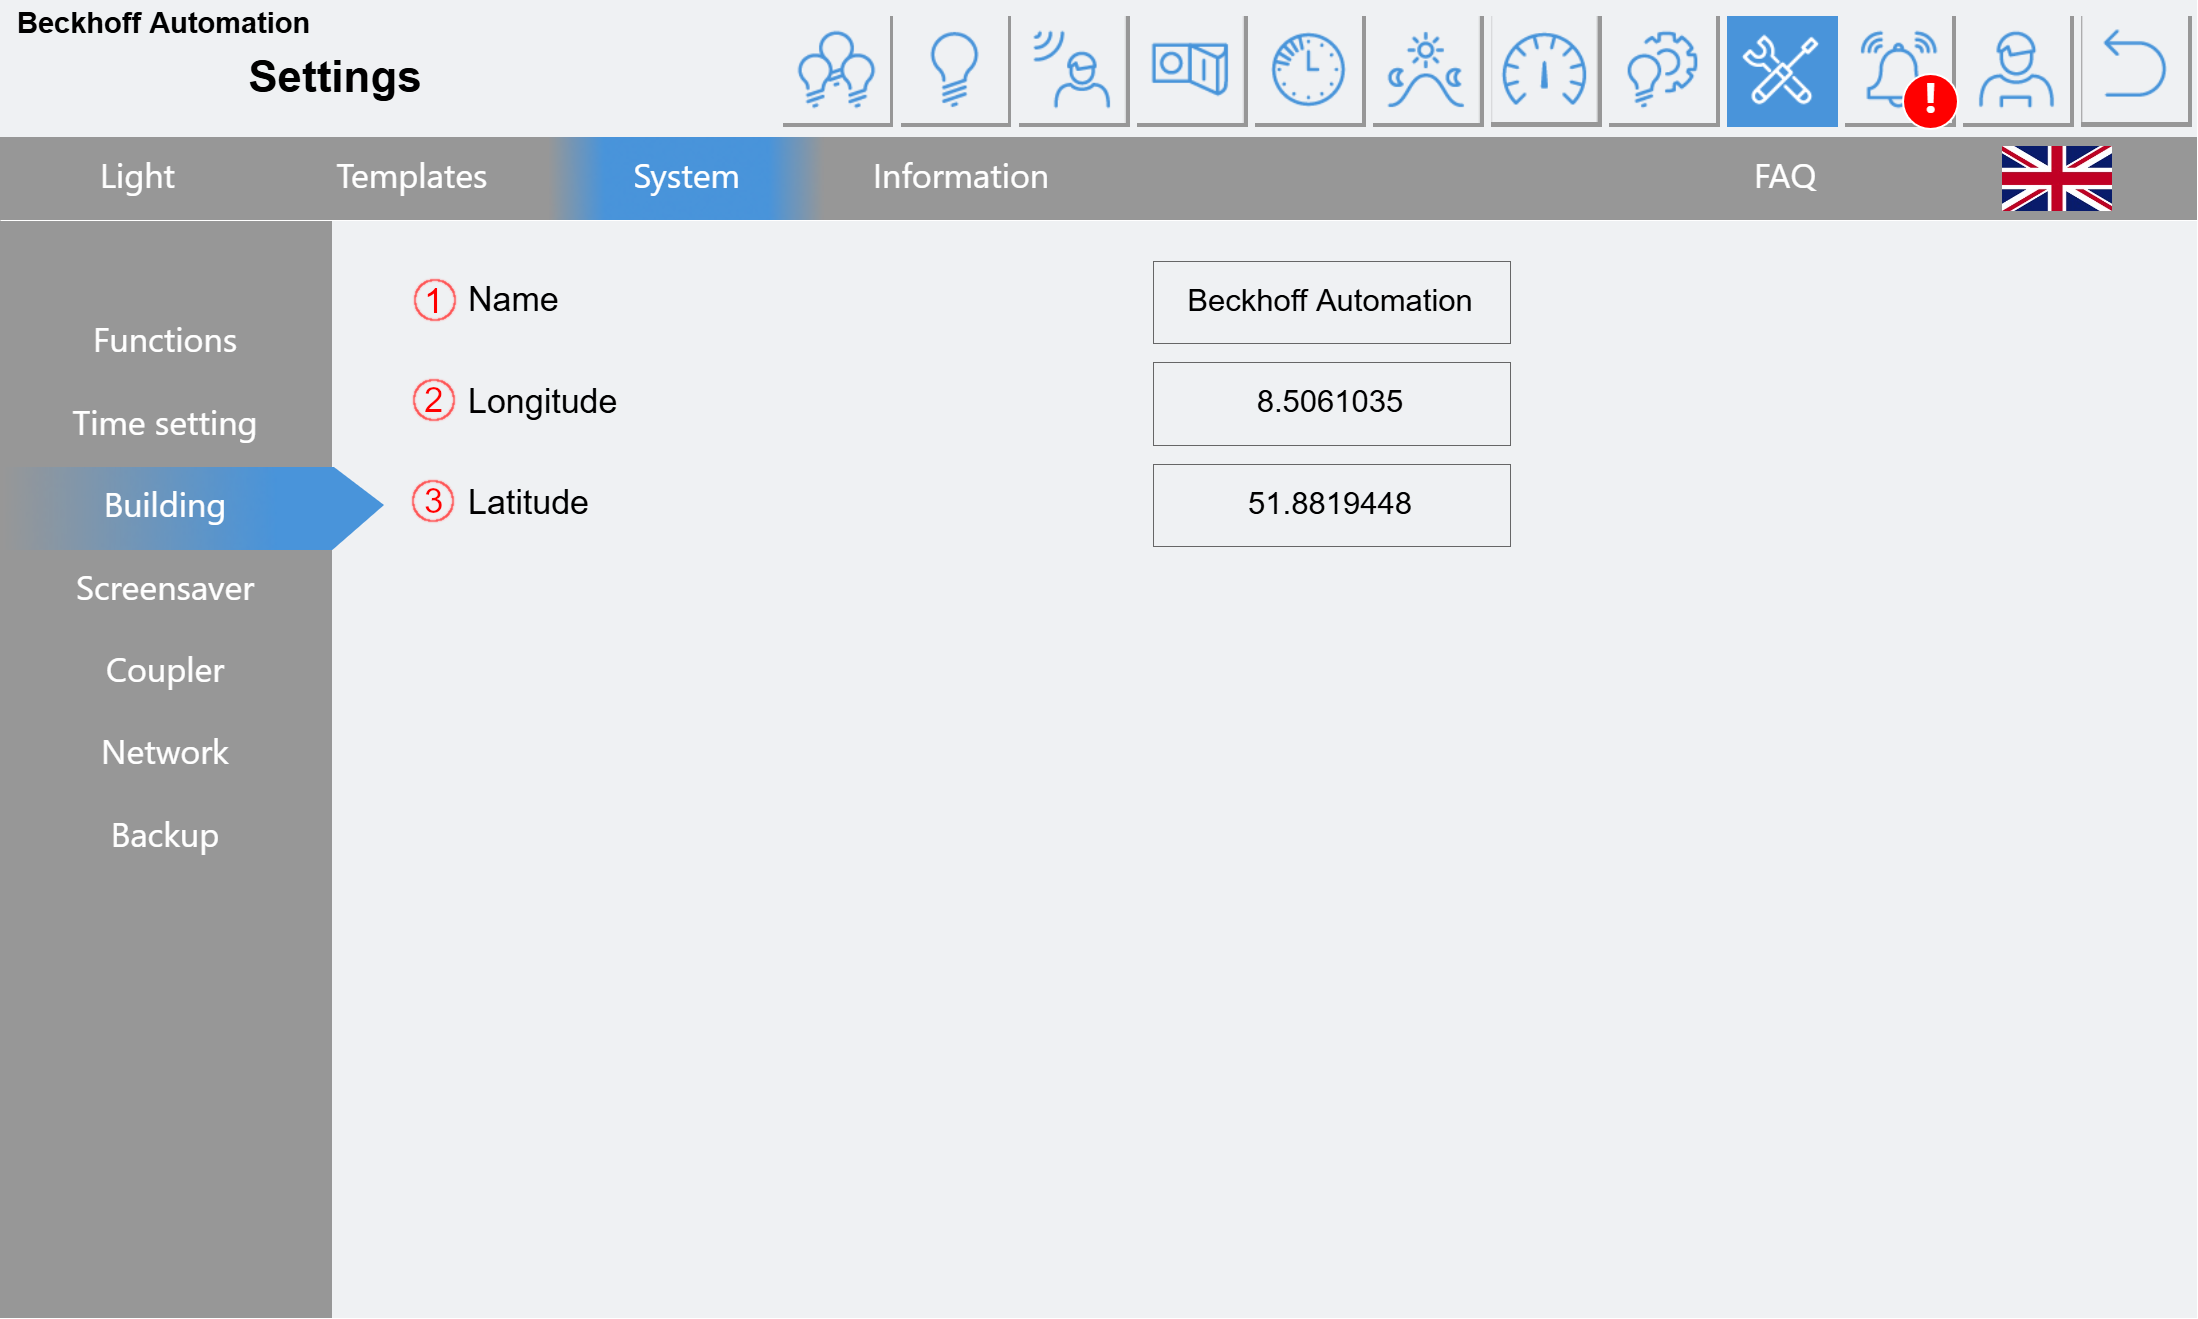
(1) The name entered here is displayed in the top left-hand corner. This is mainly used for orientation when using several controllers.
(2) Indication of the coordinates of the building. Is required for the HCL and Astro functions.
Screen saver:
A screen saver can be activated here. Regardless of the set delay, this only starts 5 minutes after a system restart. You can choose between different display options.
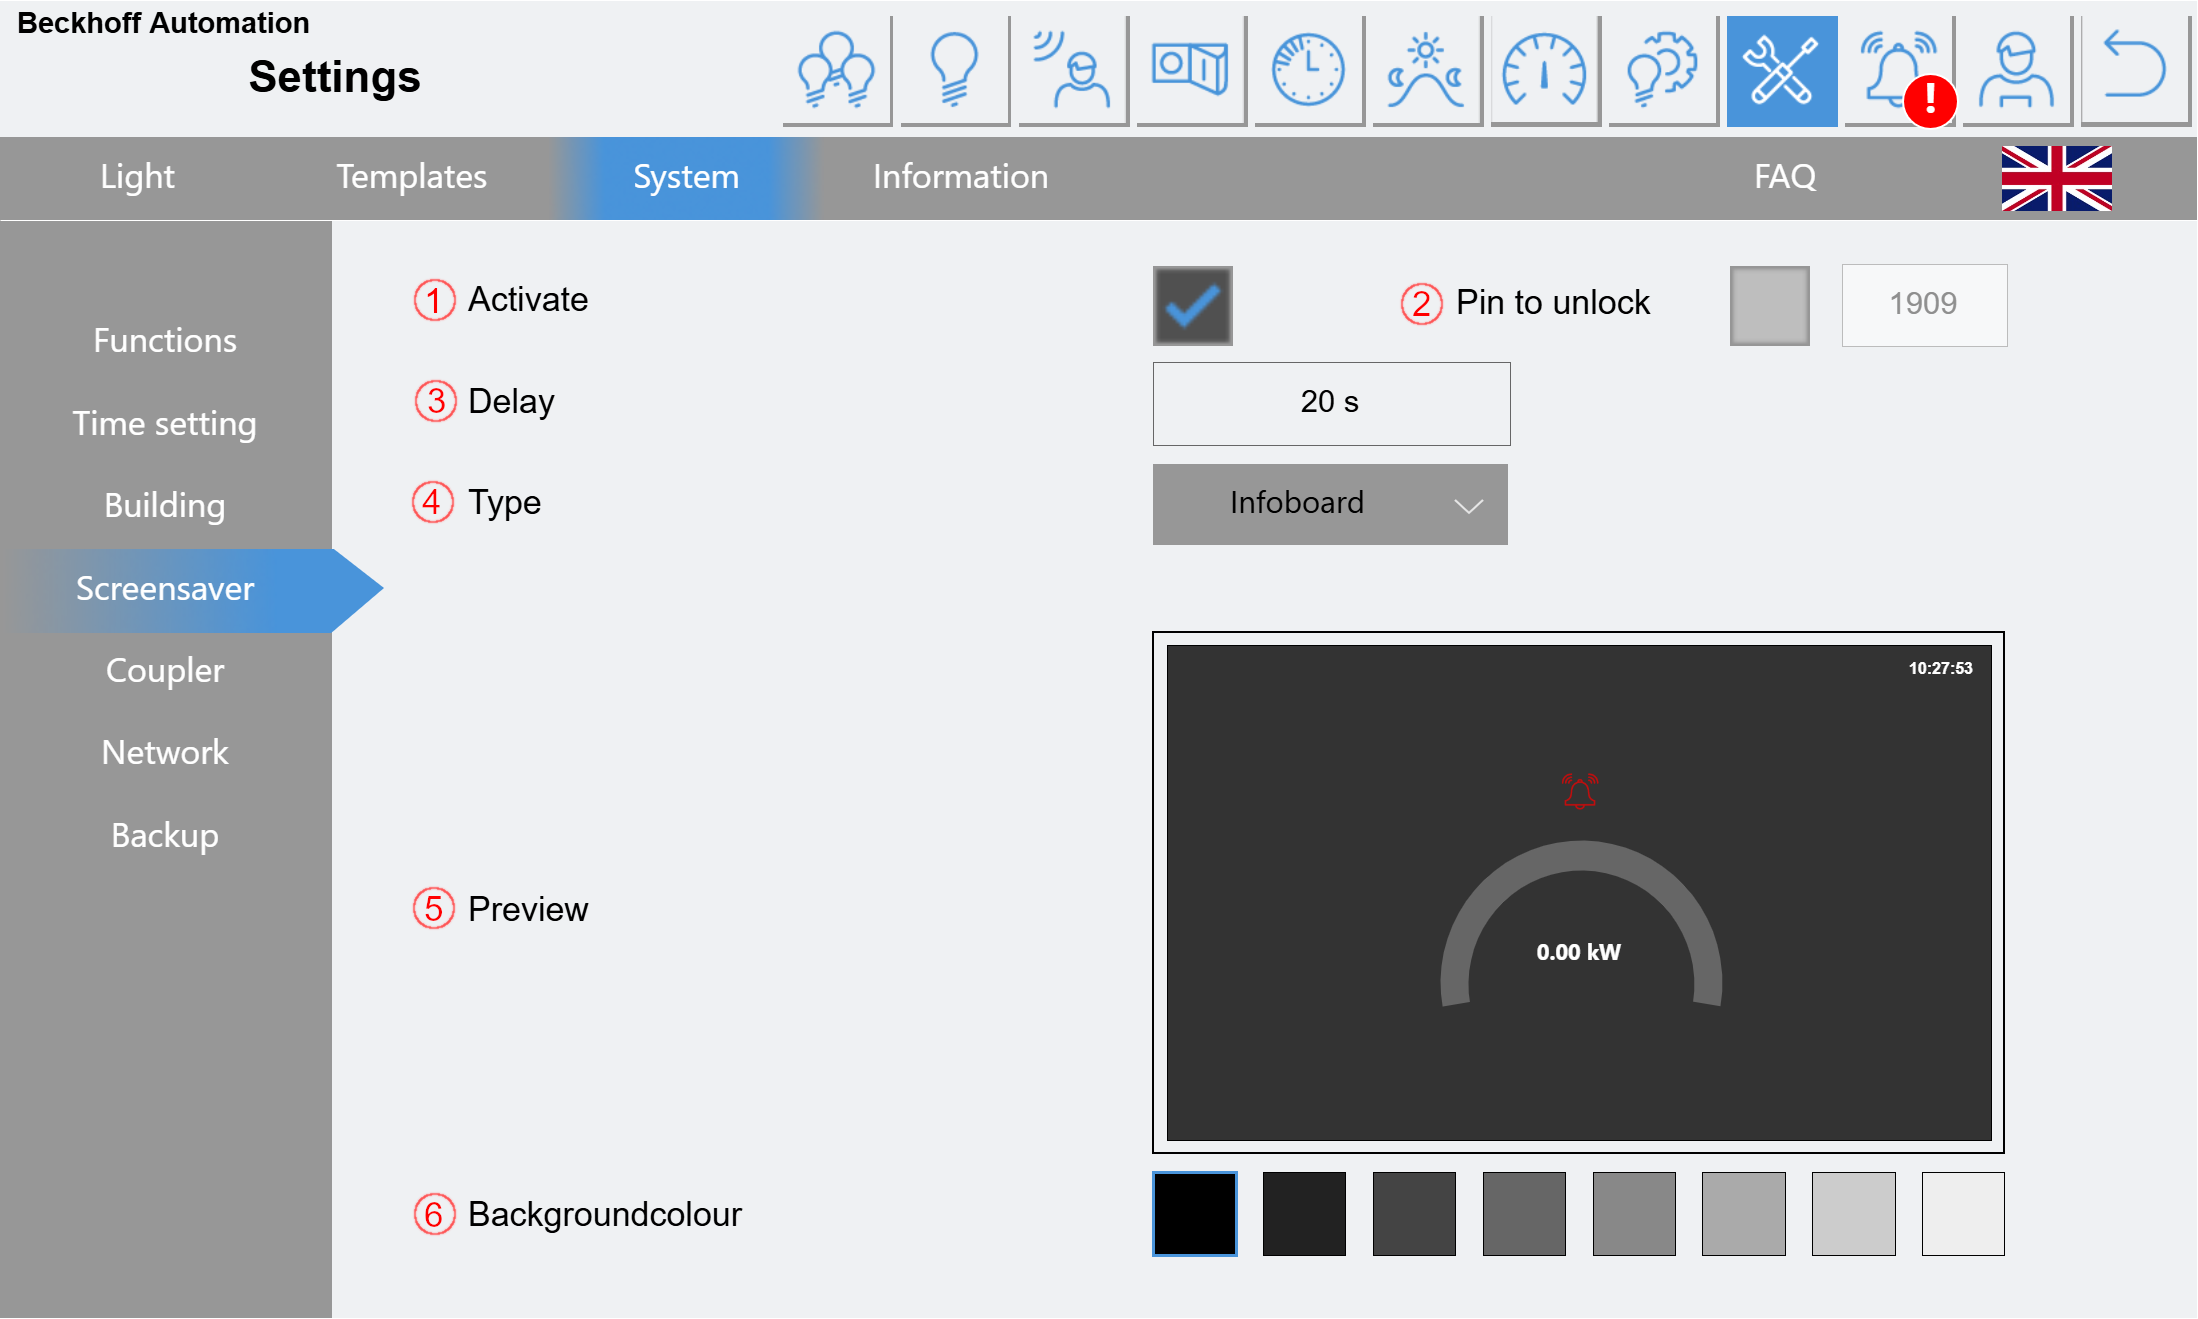
(1) Activate/deactivate the screen saver.
(2) An unlock pin can be activated and set up here.
(3) Time delay after the last operation.
(4) Various display options can be selected here:
Color: The screen only displays a clock and a fire alarm if applicable.
Infoboard: In addition to "Color", the current power and a corresponding diagram as well as an alarm bell for faults are displayed here.
Energy consumption: Shows the current power in the form of a histogram.
(5) Preview of the selection
(6) A background color can be selected here.
Coupler:
All configured bus couplers are shown here in a table.
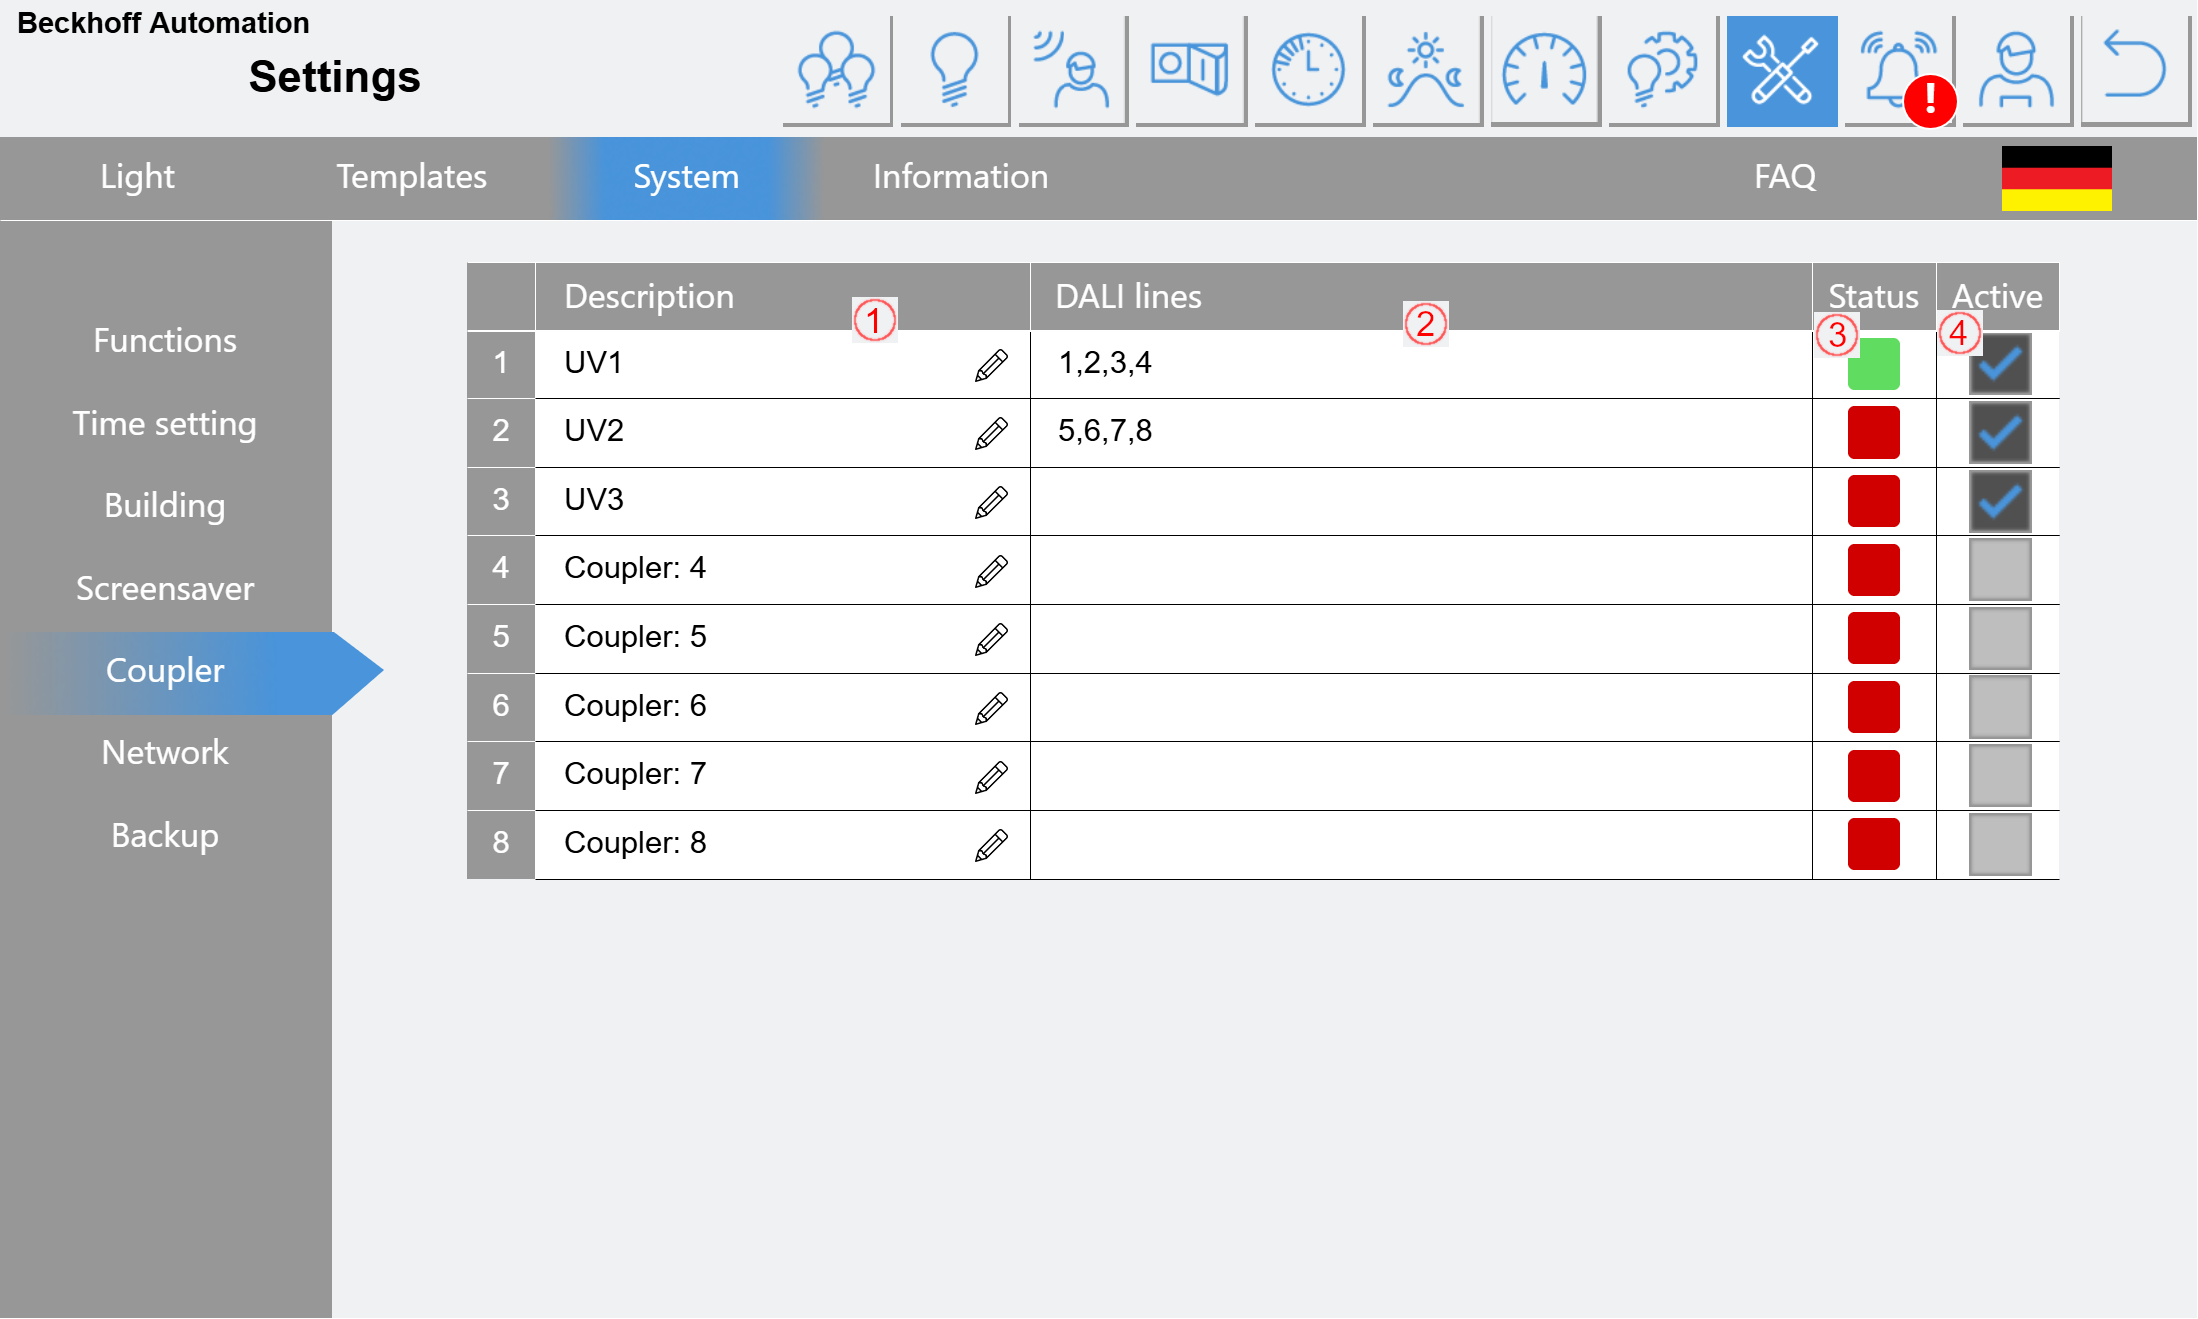
(1) The coupler description can be edited here.
(2) The assignments of the DALI lines are displayed here. These were defined as parameters when programming the controller.
(3) The status of the respective bus coupler is shown here in green/red. If the status is "red", the assigned DALI lines are not processed and there is a system fault (if (4) is activated).
(4) Only activated couplers are monitored and displayed as a fault if necessary.
Network:
Shows the IP settings and MAC addresses of the controller's interfaces.
Backup:
All settings and data can be saved, loaded or reset here. The data is protected in CSV format and is stored in the FTP folder on the device.
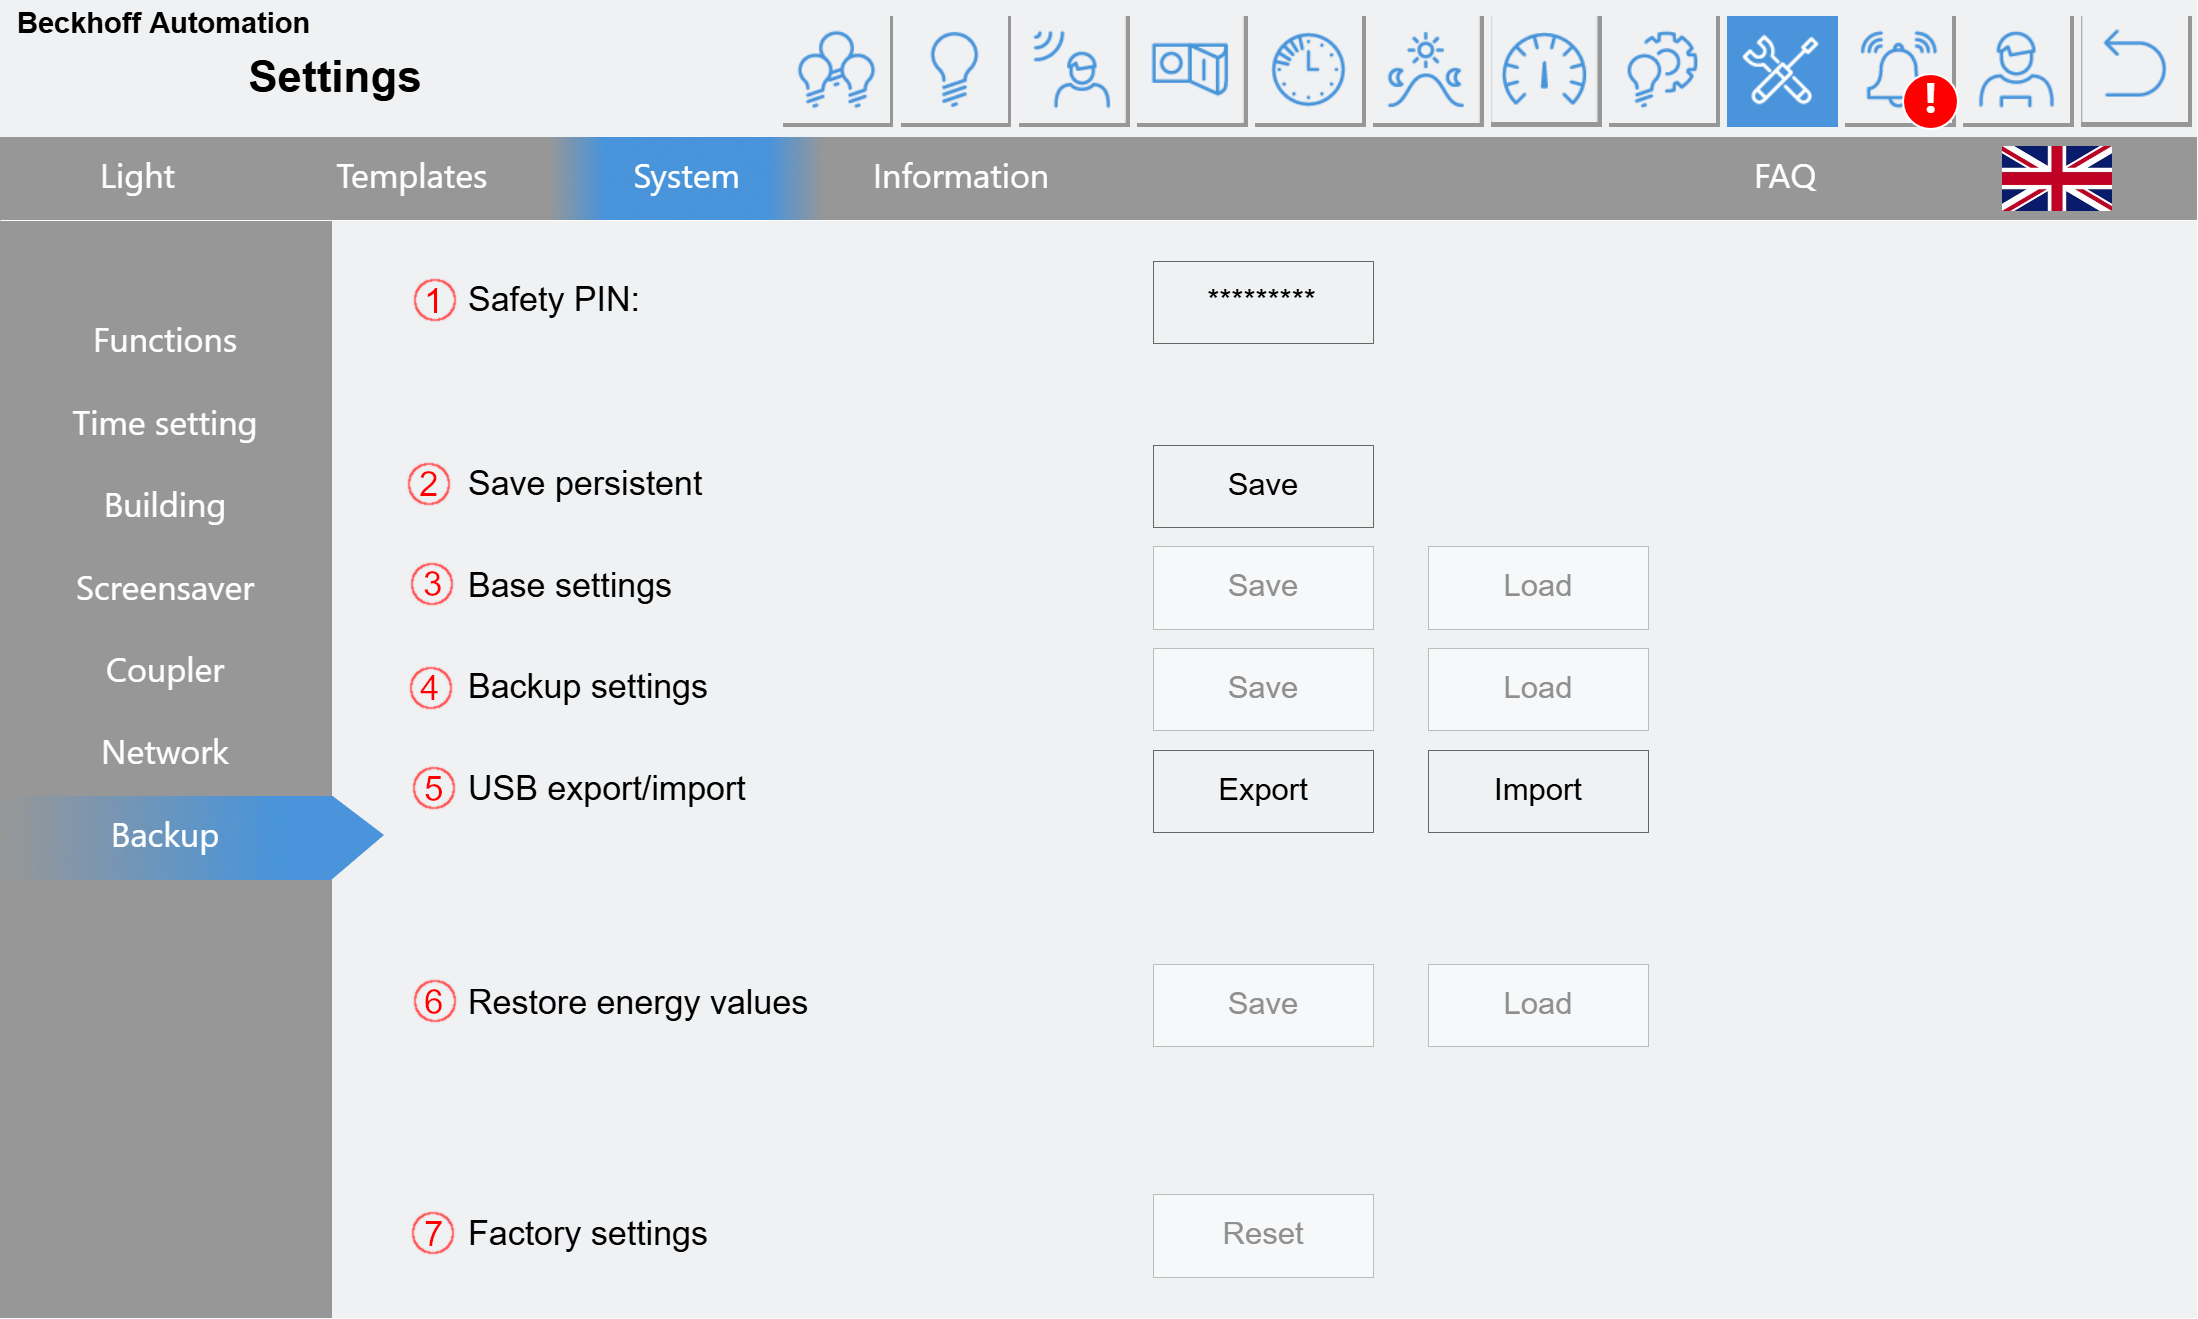
(1) The Safety PIN must be entered here. Different pins are required for different functions.
(2) Recently made changes can be saved here beyond the restart.
(3) Saving and loading the base settings writes or reads the CSV data from the FTP folder. These "base settings" are usually generated automatically once a week. When saving/loading manually, the individual files can be selected in a subsequent dialog to save time when making minor changes.
(4) The backup settings are a second level of protection. The same data is generated as in (3), but with the extension "Backup_" in the file name. This backup can only be created manually.
(5) The USB functions are pure copy functions which copy the CSV data from the FTP folder to the USB stick ("Export") and vice versa ("Import"). Before an "Export", the base settings should have been saved with (3).
(6) In the event of a loss of old energy values (hardware damage), these can be restored here. The data is located in the FTP subfolder "PersistentData" and is also automatically written with the base settings.
(7) A controller can be reset to the delivery state here.
Information:
This page provides an overview of the nominal operating hours of all lamps. The percentage of nominal operating hours already used is calculated for each lamp. The lamps are then grouped according to this percentage.
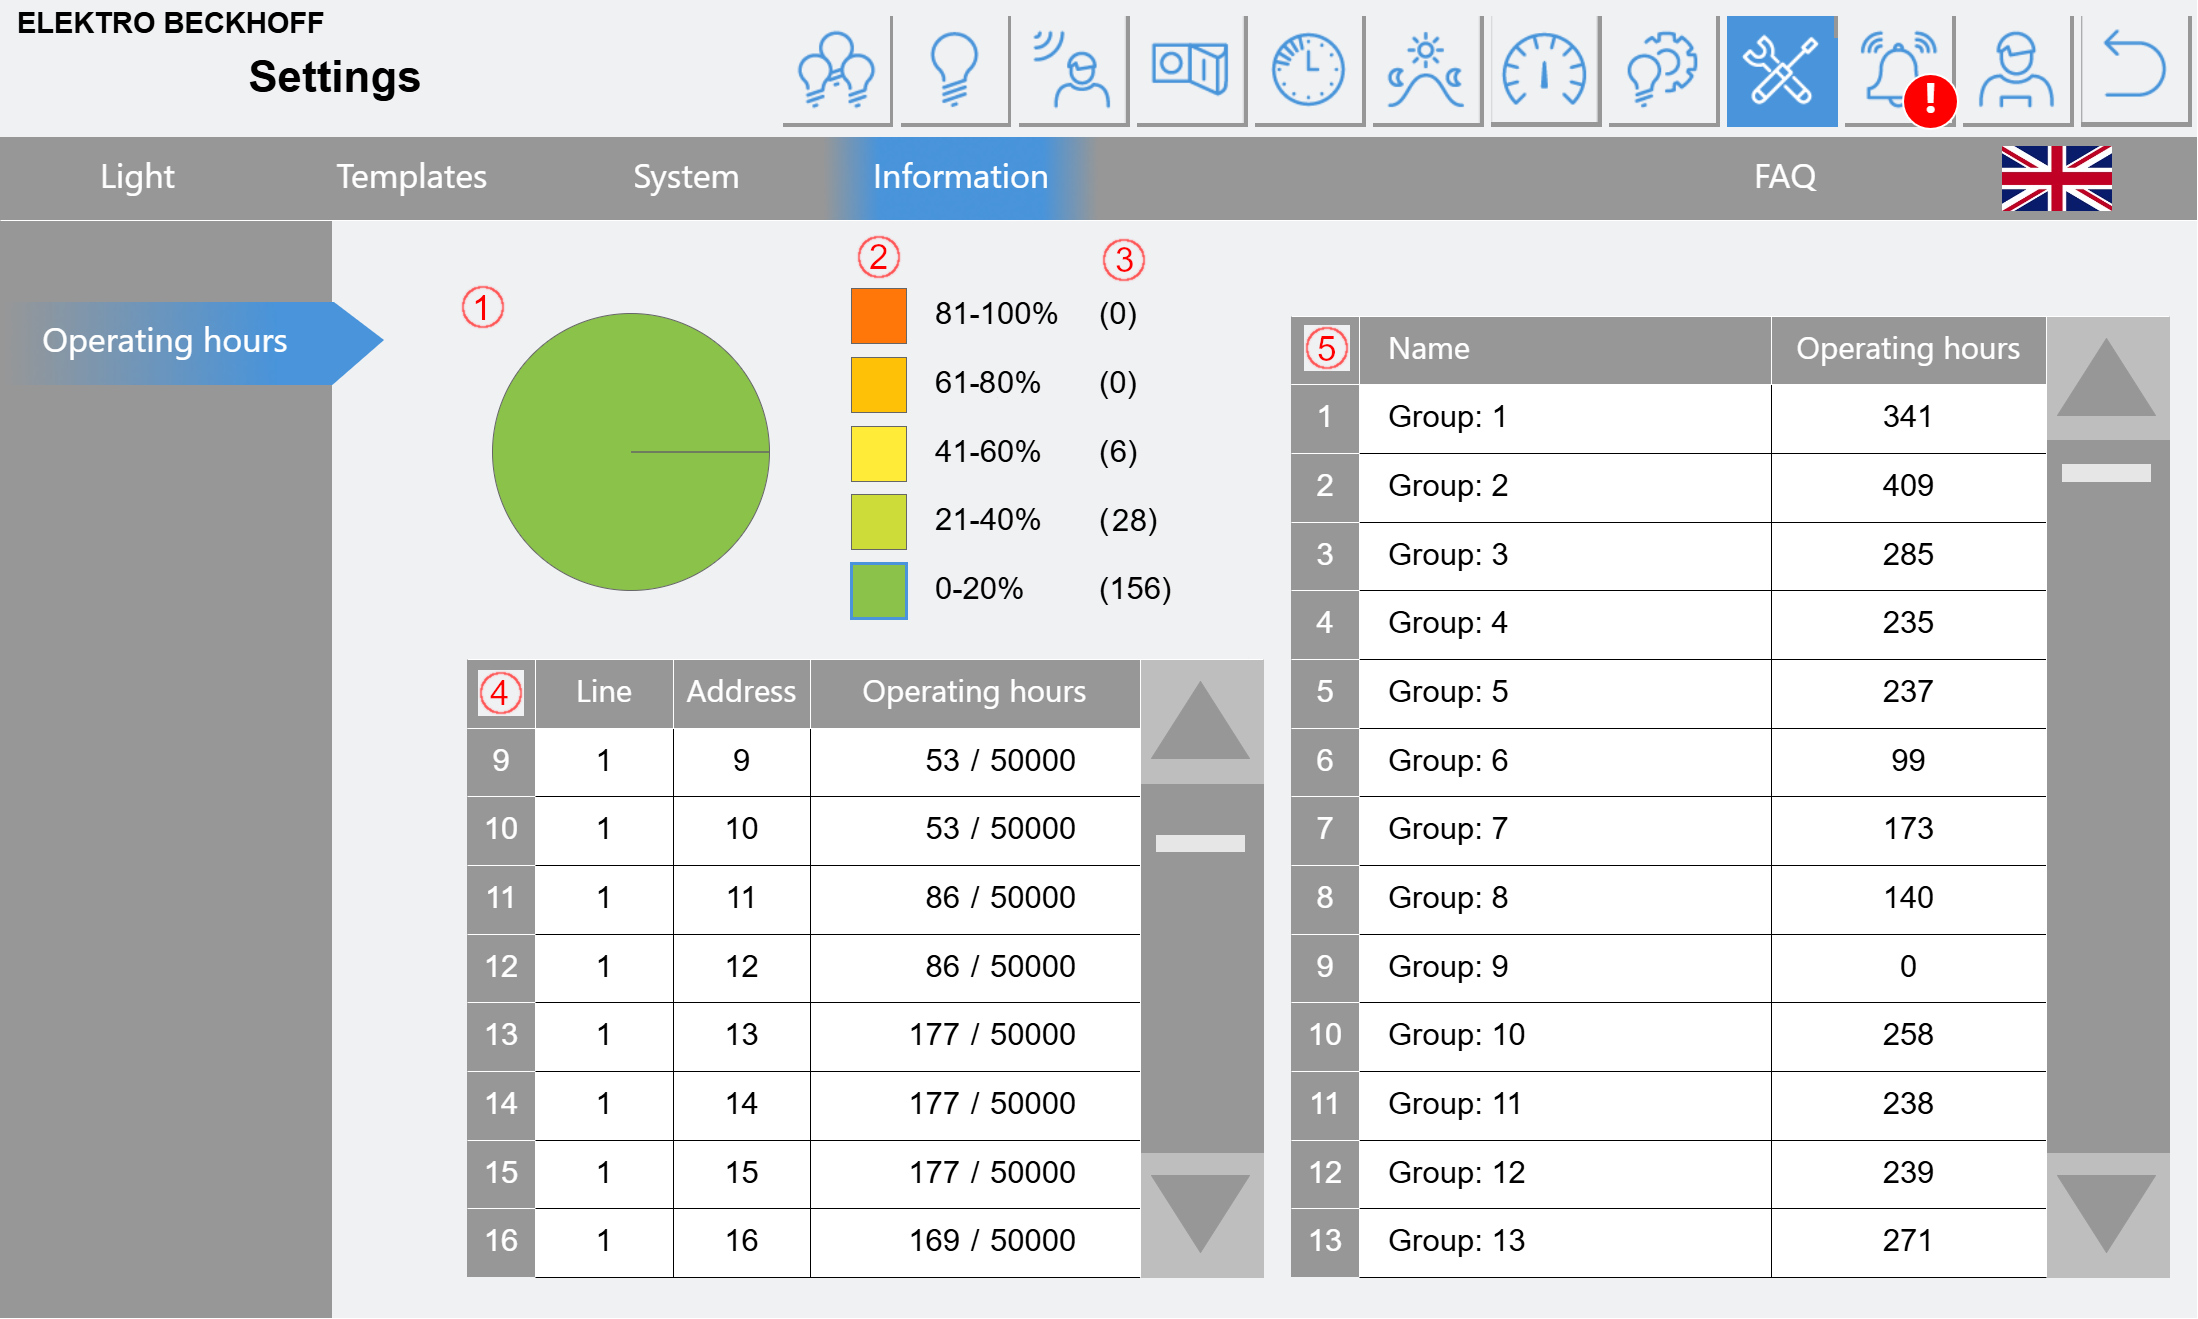
(1) The pie chart shows the percentages of (2).
(2) 5 groups are displayed, showing the percentage consumption of the nominal operating hours. Click on one of the colored fields to update the table (4).
(3) Number of lamps located in the corresponding area.
(4) The table lists up to 100 lamps that are located in the area selected under (2).
(5) The table shows the operating hours according to the switching groups.
FAQ:
Shows the current version number, as well as QR codes and buttons as shortcuts to this document.