Optimization
A table shows the average usage data of the individual groups and also deals with the automatic overrun time optimization. The automatic optimization uses an algorithm based on usage behavior to decide whether the set overrun time should be longer or can be set shorter.
This function is always active and new suggestions for optimization are provided once a day. A change to the overrun time is set to ±10 s. You can decide for each group whether the suggestions are to be adopted automatically and whether the overrun time is to be changed directly. If no automatic system is active, each proposal must be accepted manually.
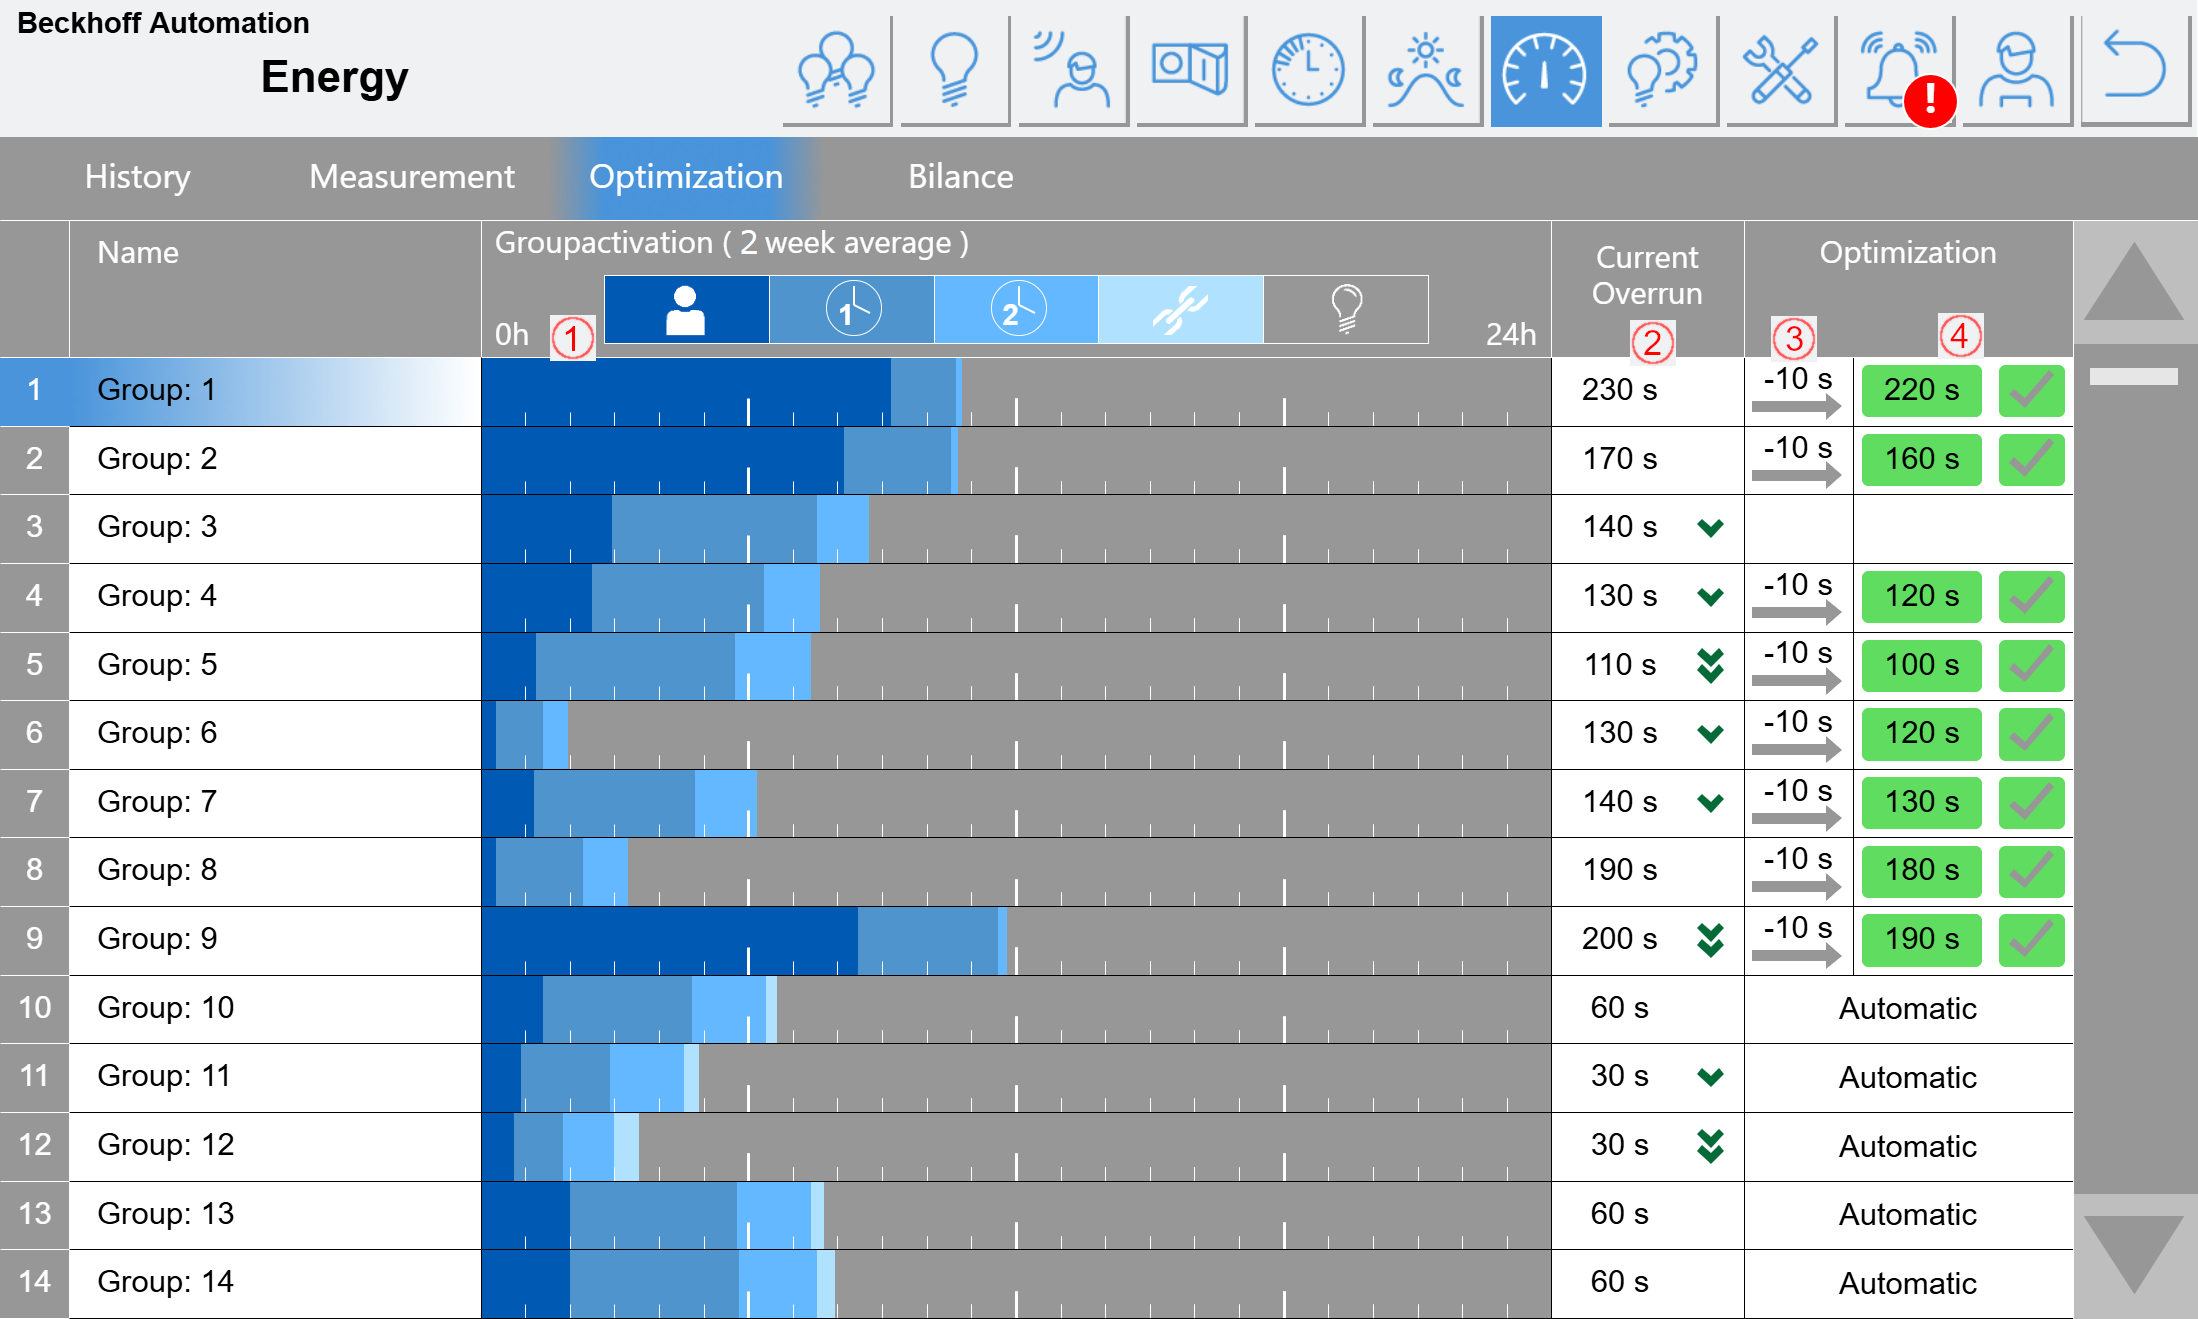
(1) The bar chart shows the average state of the respective group based on 24 hours. A different color indicates how long the group has been in "Presence", "Overrun time 1", Overrun time 2" or "External" (e.g. slave mode). This data can be used to decide whether, for example, the presence/overrun time ratio is correct or the overrun time is set too long.
(2) This column displays the 1st overrun time in seconds. Green and red arrows show the trend of recent changes.
(3) Display of the proposed overrun time change.
(4) Display of the new overrun time. The proposal can be accepted by clicking on the green tick.
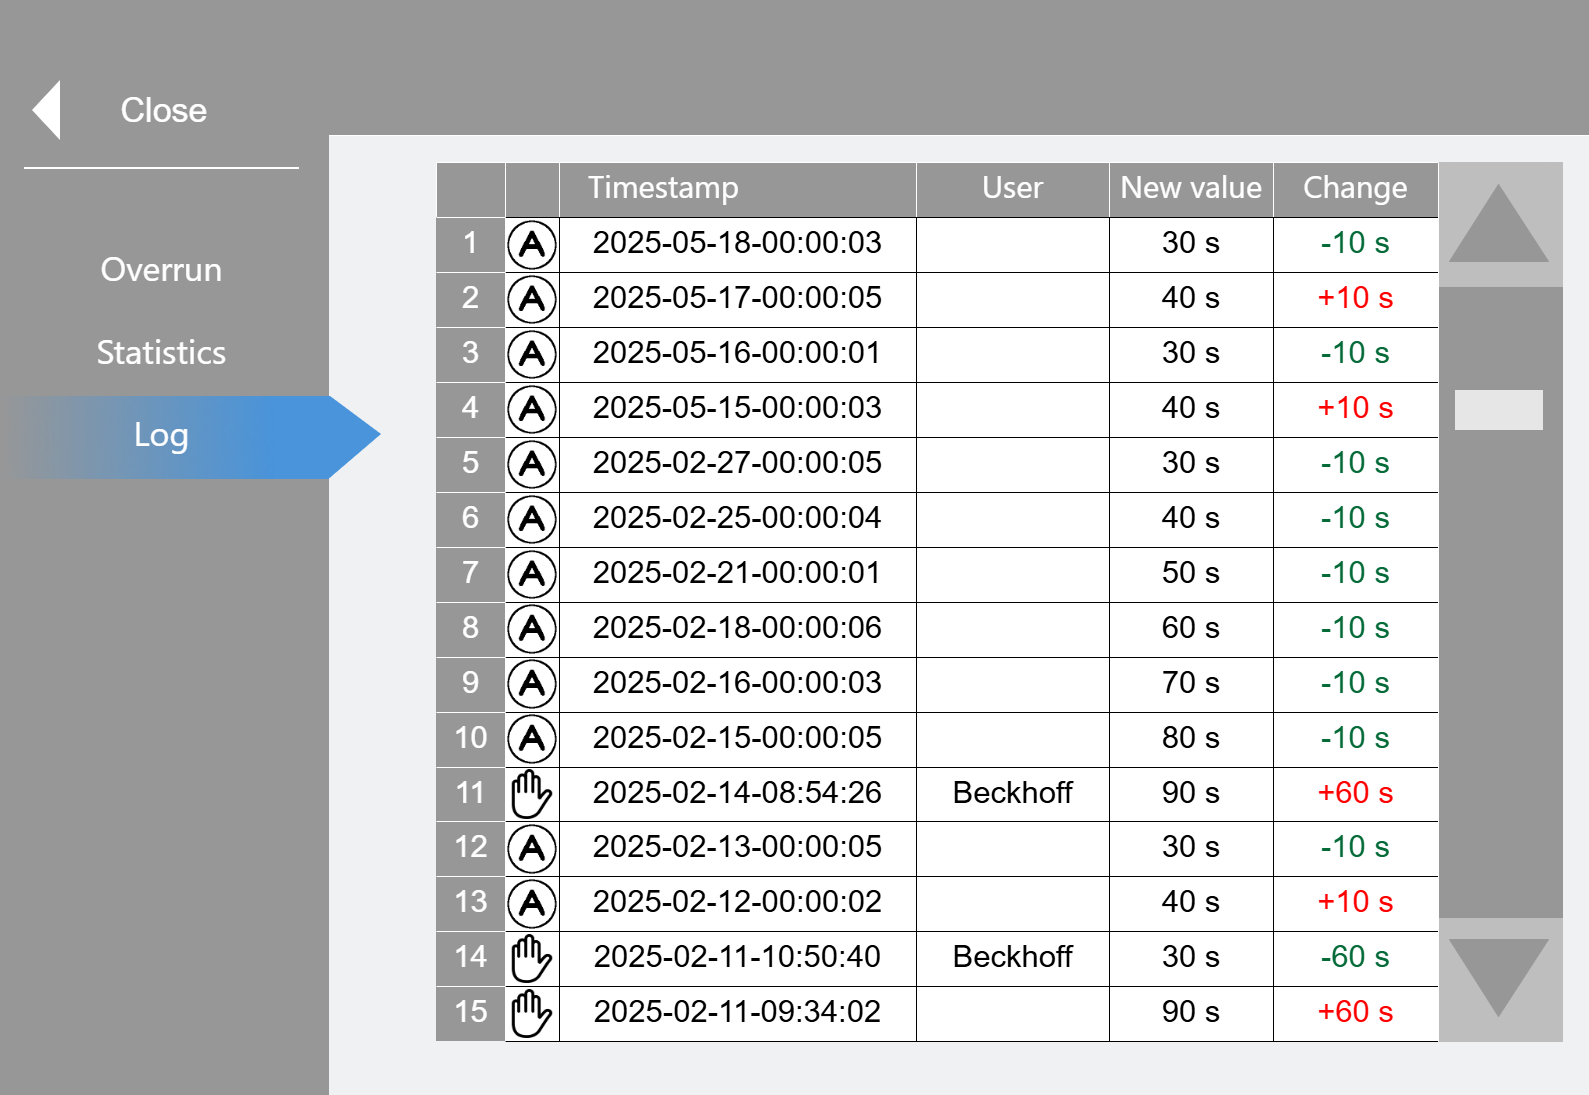
A menu can be opened again for each group to view a "log" of the last changes, among other things. The times are viewed/changed or automatic optimization is activated under Overrun.