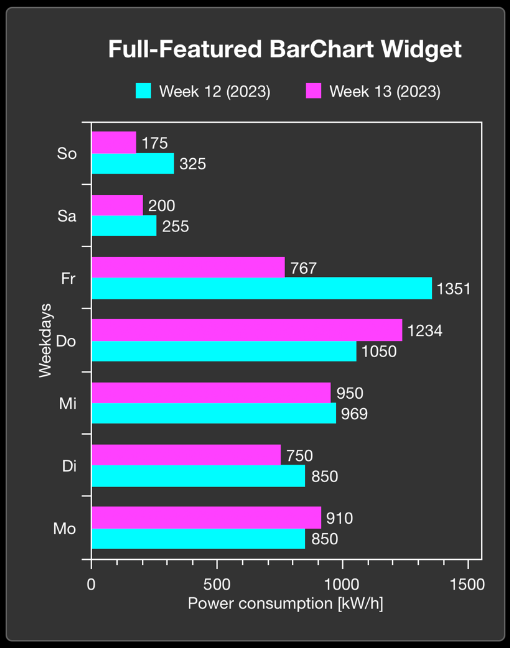
Bar chart
The widget described is suitable for displaying a horizontal bar chart in the app. This bar chart can display both individual bars and two bars to be compared. The various configuration options are described below. In the figure all available features of the widget are active.
The widget is transferred as a substructure in the overall structure of the SendData() method. To build the widget, various PLC attributes are used when declaring the structure.
{attribute 'iot.DisplayName' := 'Name for Widget'}
{attribute 'iot.WidgetType' := 'BarChart'}
{attribute 'iot.ChartXAxisLabel' := 'Name for X Axis'}
{attribute 'iot.ChartYAxisLabel' := 'Name for Y Axis'}
{attribute 'iot.Unit' := 'Unit for X Axis'}
{attribute 'iot.ChartLegendVisible' := 'true'}
{attribute 'iot.ChartValuesVisible' := 'true'}
{attribute 'iot.MinValue':='0'}
{attribute 'iot.MaxValue':='1550'}
{attribute 'iot.ChartBarColor1' := '#00FFFF'}
{attribute 'iot.ChartBarColor2' := '#FF00FF'}
stChart    : ST_BarChartWidgetSample;
Attribute | Data type | Description |
|---|---|---|
iot.DisplayName | STRING | The display name of the widget in the app. This will be overwritten by sDisplayName as soon as sDisplayName is not an empty string. |
iot.WidgetType | STRING | Type specification for the widget, in this case: BarChart. |
ioT.ChartXAxisLabel | STRING | The display name of the X-axis. |
ioT.ChartYAxisLabel | STRING | The display name of the Y-axis. |
iot.Unit | STRING | Unit displayed in square brackets after the display name of the X-axis. |
ioT.ChartLegendVisible | BOOL | Determines whether the legend is displayed (TRUE) or not (FALSE). |
ioT.ChartValuesVisible | BOOL | Determines whether the values of the bars are displayed in the diagram (TRUE) or not (FALSE). |
iot.MinValue | INT | Lower limit of the value range of the diagram. |
iot.MaxValue | INT | Upper limit of the value range of the diagram. |
ioT.ChartBarColor1 | STRING | Fixes the color of the upper bars. The list of available colors can be found at List of available colors. The color must either be specified in one of the strings given in the appendix or as a hex code with "#" in front of the value. |
ioT.ChartBarColor2 | STRING | Fixes the color of the lower bars. The list of available colors can be found at List of available colors. The color must either be specified in one of the strings given in the appendix or as a hex code with "#" in front of the value. |
TYPE ST_BarChartWidgetSample :
STRUCT
    sDisplayName          : STRING := '';
    aDataSeries           : ARRAY[0..n] OF INT;
    aComparismDataSeries  : ARRAY[0..n] OF INT;
    aDataSeriesIdentifier : ARRAY[0..n] OF STRING;
    aLegendLabels         : ARRAY[0..n] OF STRING;
END_STRUCT
END_TYPE
Attribute | Data type | Description | Display in widget |
|---|---|---|---|
sDisplayName | STRING | Determines the display name of the widget and overwrites the PLC attribute 'iot.DisplayName'. | Display text of the widget. |
aDataSeries | ARRAY [0..n] OF INT | The first data series displayed in the bar chart. The array must be the same size as the ComparismDataSeries and the DataSeriesIdentifier. | Length of the upper beams. |
aComparismDataSeries | ARRAY [0..n] OF INT | The second data series displayed in the bar chart. The array must be the same size as the DataSeries and the DataSeriesIdentifier. When sending an empty array, a bar chart with only one bar is displayed. | Length of the lower beams. |
aDataSeriesIdentifier | ARRAY [0..n] OF STRING | Names of the values on the Y-axis. This array must be the same size as the DataSeries and the ComparismDataSeries. | Labels of the values on the Y-axis. |
aLegendLabels | ARRAY [0..0] OF STRING | Legend of the bar chart. The size of the array is determined by the number of bars displayed. | Between the title of the widget and the diagram. |