Troubleshooting and debugging
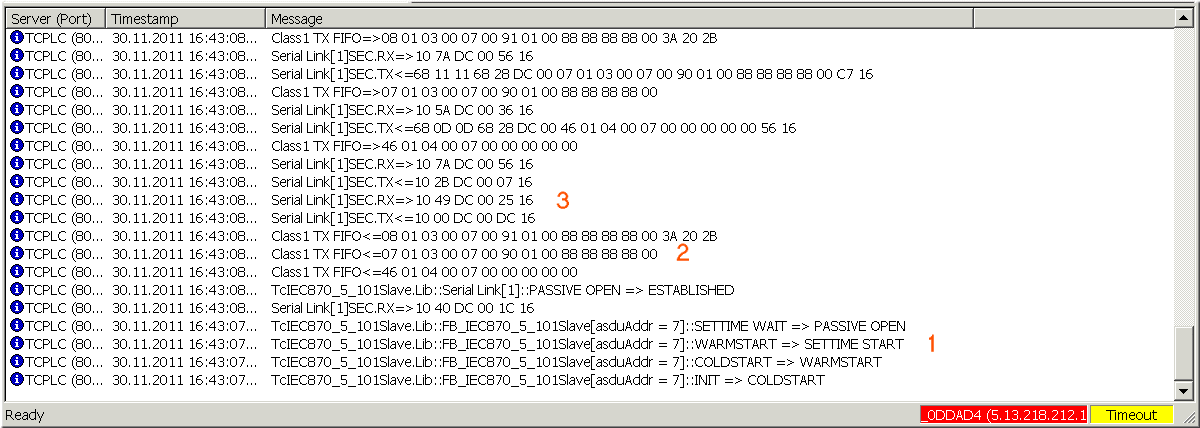
Debugging messages written to the application log facilitate troubleshooting of the system. Currently, three levels of debug messages can be activated in an IEC application. These messages can be activated via the dbgMode system parameter of the control station (ST_IEC870_5_101SystemParams).
- Station status messages (dbgMode: IEC870_DEBUGMODE_DEVSTATE);
- Hexadecimal output of the ASDU's (without link layer control header, dbgMode: IEC870_DEBUGMODE_ASDU). 32 ASDU data bytes per row are output as hexadecimal numbers. Longer ASDUs are spread across several rows;
- Hexadecimal output of the APDU's (serial port telegrams, dbgMode: IEC870_DEBUGMODE_LINKLAYER). 32 APDU data bytes per row are output as hexadecimal numbers. Like in 2., longer APDUs are spread across several rows;
Optionally, link layer errors can also be output (dbgMode: IEC870_DEBUGMODE_LINKERROR). In order to view the activated debug messages start the TwinCAT System Manager and activate log view. A debugging output is shown below. The three different message types are identified with the respective numbers.
Further diagnostic tools:
- Portmon for Windows (v3.02, Windows Sysinternals);
- Diverse protocol test suite products;