Diagnostics
There are different configuration levels on which you can find diagnostics information. This information is available in a separate tab page on the corresponding configuration element.
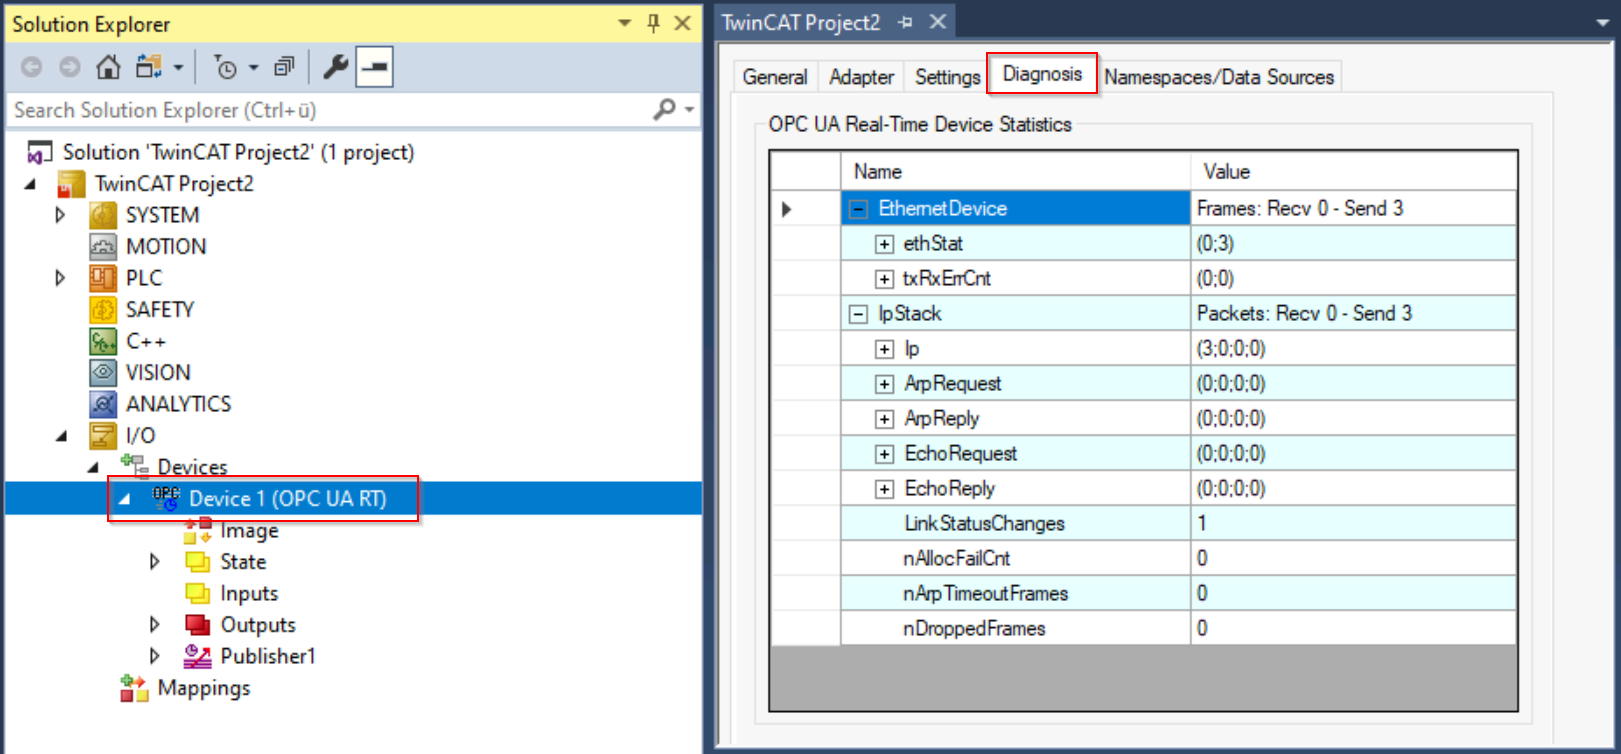
Device
The OPC UA RT device contains the tab Diagnosis, which includes different metrics to find out if and how many packets are send or received by the underlying IP stack.
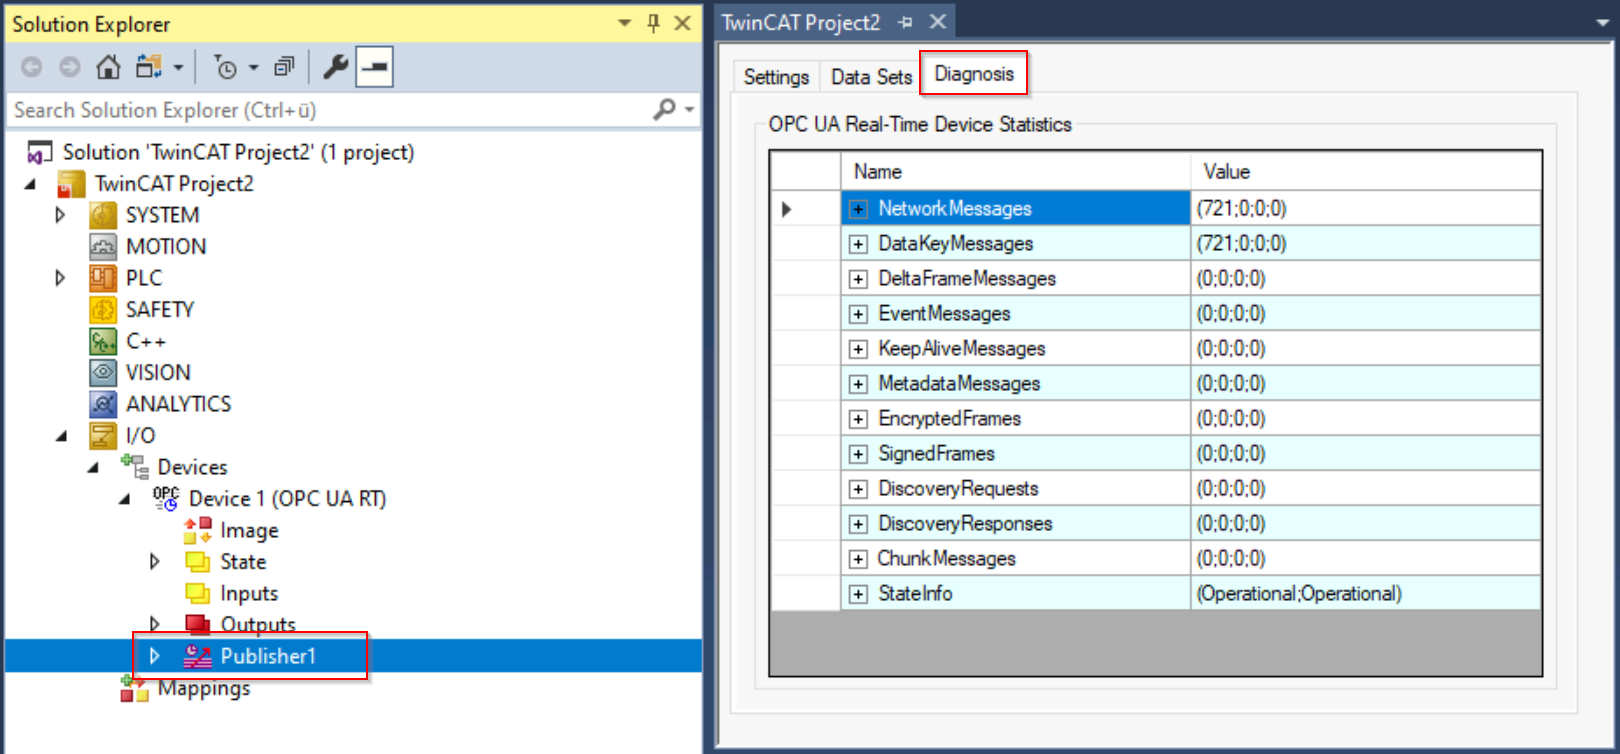
Publisher/Subscriber
Each publisher or subscriber contains a Diagnosis tab that includes different metrics for that particular publisher or subscriber.
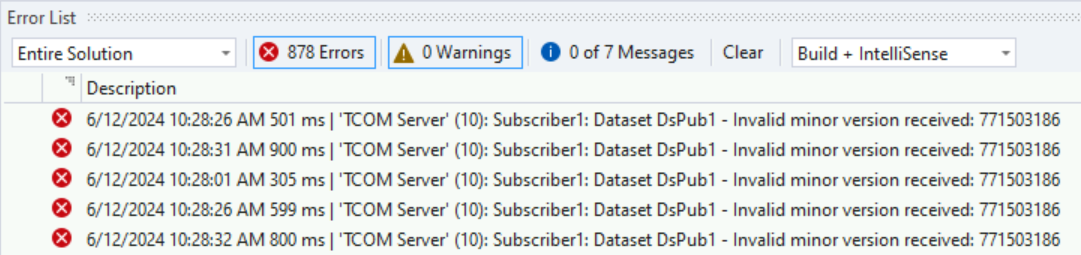
TwinCAT Error List
The TwinCAT OPC UA Pub/Sub driver also sends logging information to the TwinCAT Error List window, which can be accessed from TwinCAT XAE.
Wireshark
Wireshark is a good software tool for advanced debugging and diagnostics. You can also use Wireshark to diagnose OPC UA Pub/Sub packets.
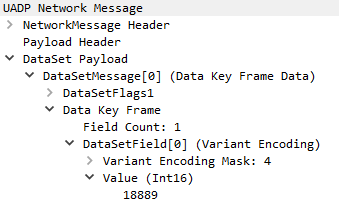
Example: the following Wireshark trace shows traffic caused by the configured Publisher that sends out packets every 1000ms (timestamp shown in first column) to the UDP Multicast group 224.0.0.1.
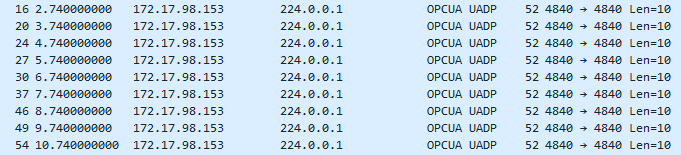
Each packet contains the configured DataSet and its (in our case "counter") variable of data type INT (which equals Int16).
 | Wireshark plugin/dissector You might require the OPC UA Pub/Sub Wireshark dissector if you want to trace and interpret the Pub/Sub messages in a readable manner. |